


Stats sections from the Kombai gallery: a payments network's four figures, a home-sharing marketplace's fast facts and a sales platform's results under a customer quote.
What is a stats section?
A stats section puts three or four big numbers on a page, each with a label that says what it counts: customers served, money moved, hours saved. It turns a claim like "teams love it" into something people can weigh. It often sits under the hero or next to customer quotes, and on about and careers pages.
- Each stat is a large figure with its unit, and a short label under or beside it.
- A heading or a source line tells people what the numbers prove and where they come from.
Stats sections show up across hero, testimonials, about and case studies screens.
When to use a stats section
- Proof of scaleCustomers, countries or volume that show the product is real and used.
- Measured resultsTime saved, conversion lifted or costs cut, backed by a source.
- Company factsFounded, team size and offices on about and careers pages.
When not to use one
- Small or vague numbers"100+ happy customers" weakens the page. Leave it out until the numbers are strong.
- Numbers people must compareTrends and breakdowns need a chart or a table, not a row of figures.
- Claims you cannot sourceIf you can't say where a figure comes from, don't print it.
Anatomy of a stats section
This one works. Switch between this year and all time and the figures count to the new values, or tab to the switch and use the arrow keys.
- Loading
- Counting up
- Settled
- Keyboard focus
- HeadingSays what the numbers prove
- FigureThe number, with its unit
- LabelSays what it counts
- Period switchOptional, picks the range
- SourceWhere and when it was counted
- StatesLoading, counting, settled, focus
Stats section variants
We sorted every stats design in the Kombai gallery and found six patterns. Browse all 136 web and 38 mobile designs.
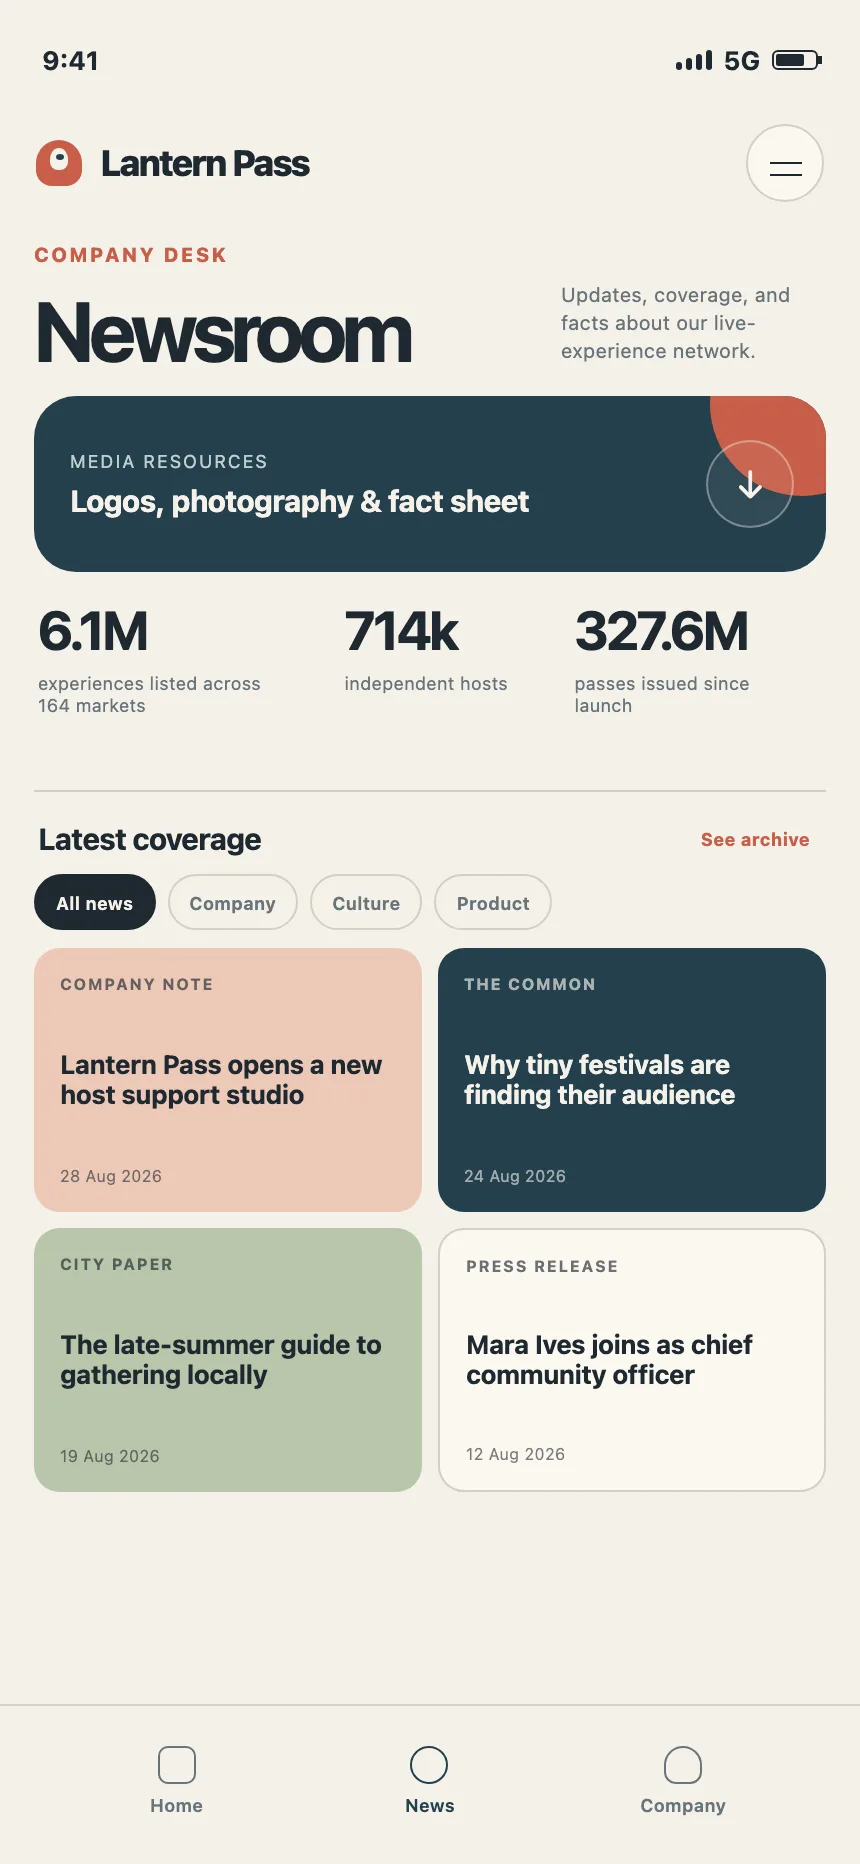
1. Number row
The default. Three or four figures side by side, each with a small label, often split by thin rules.


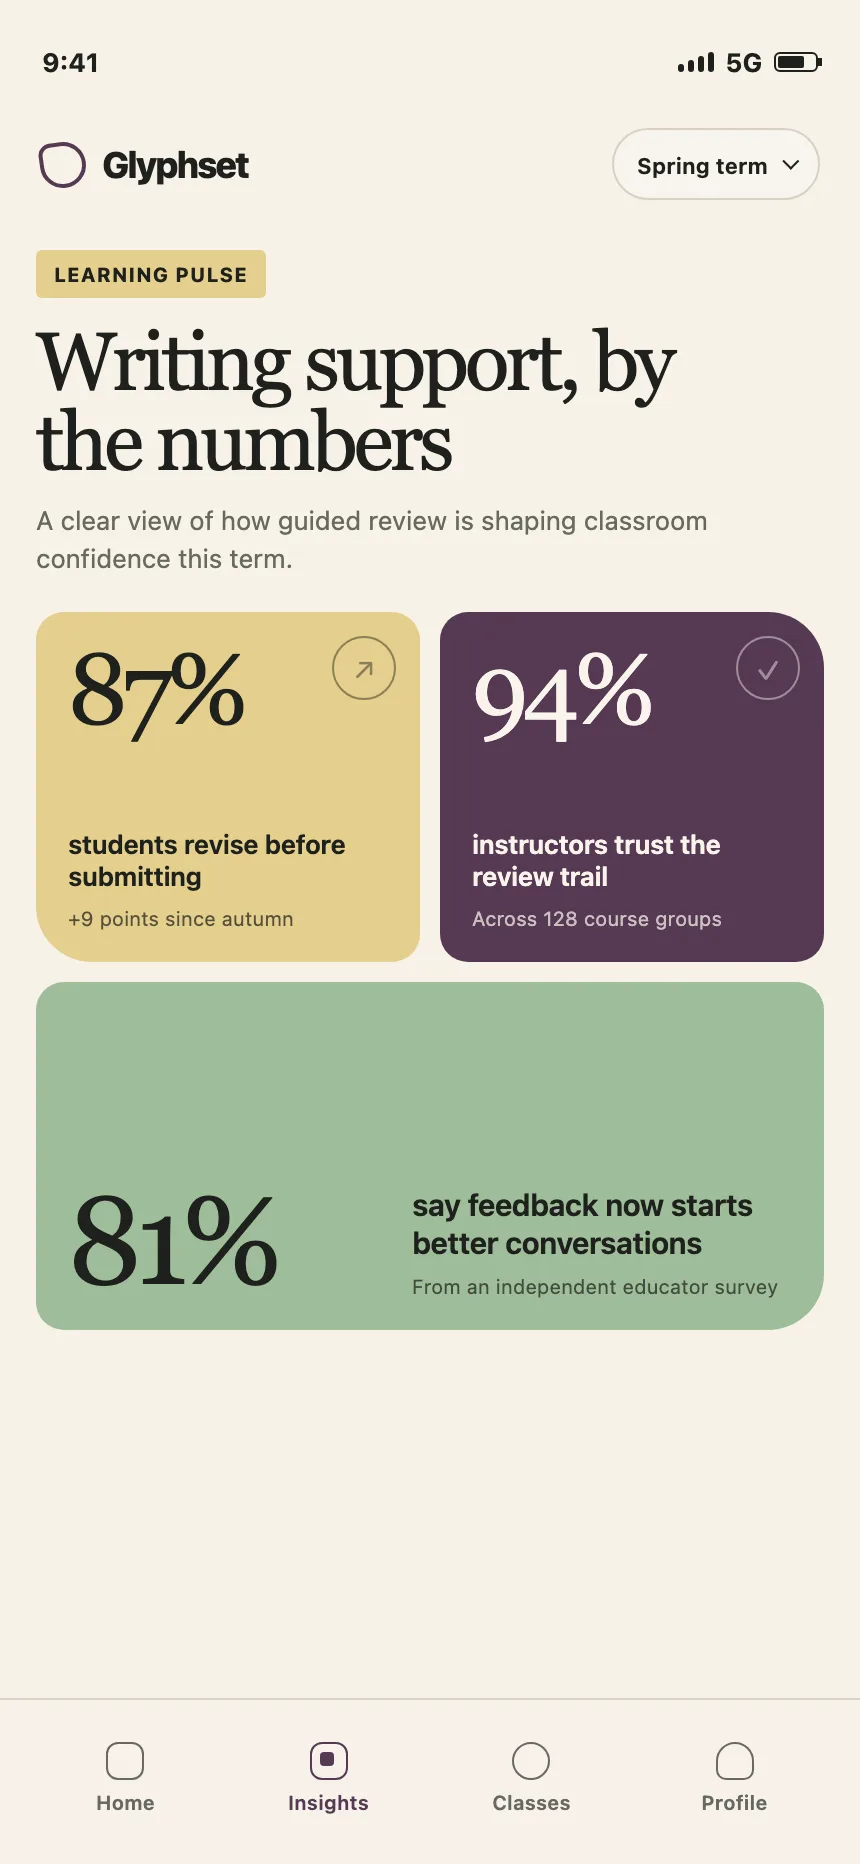
2. Stat cards
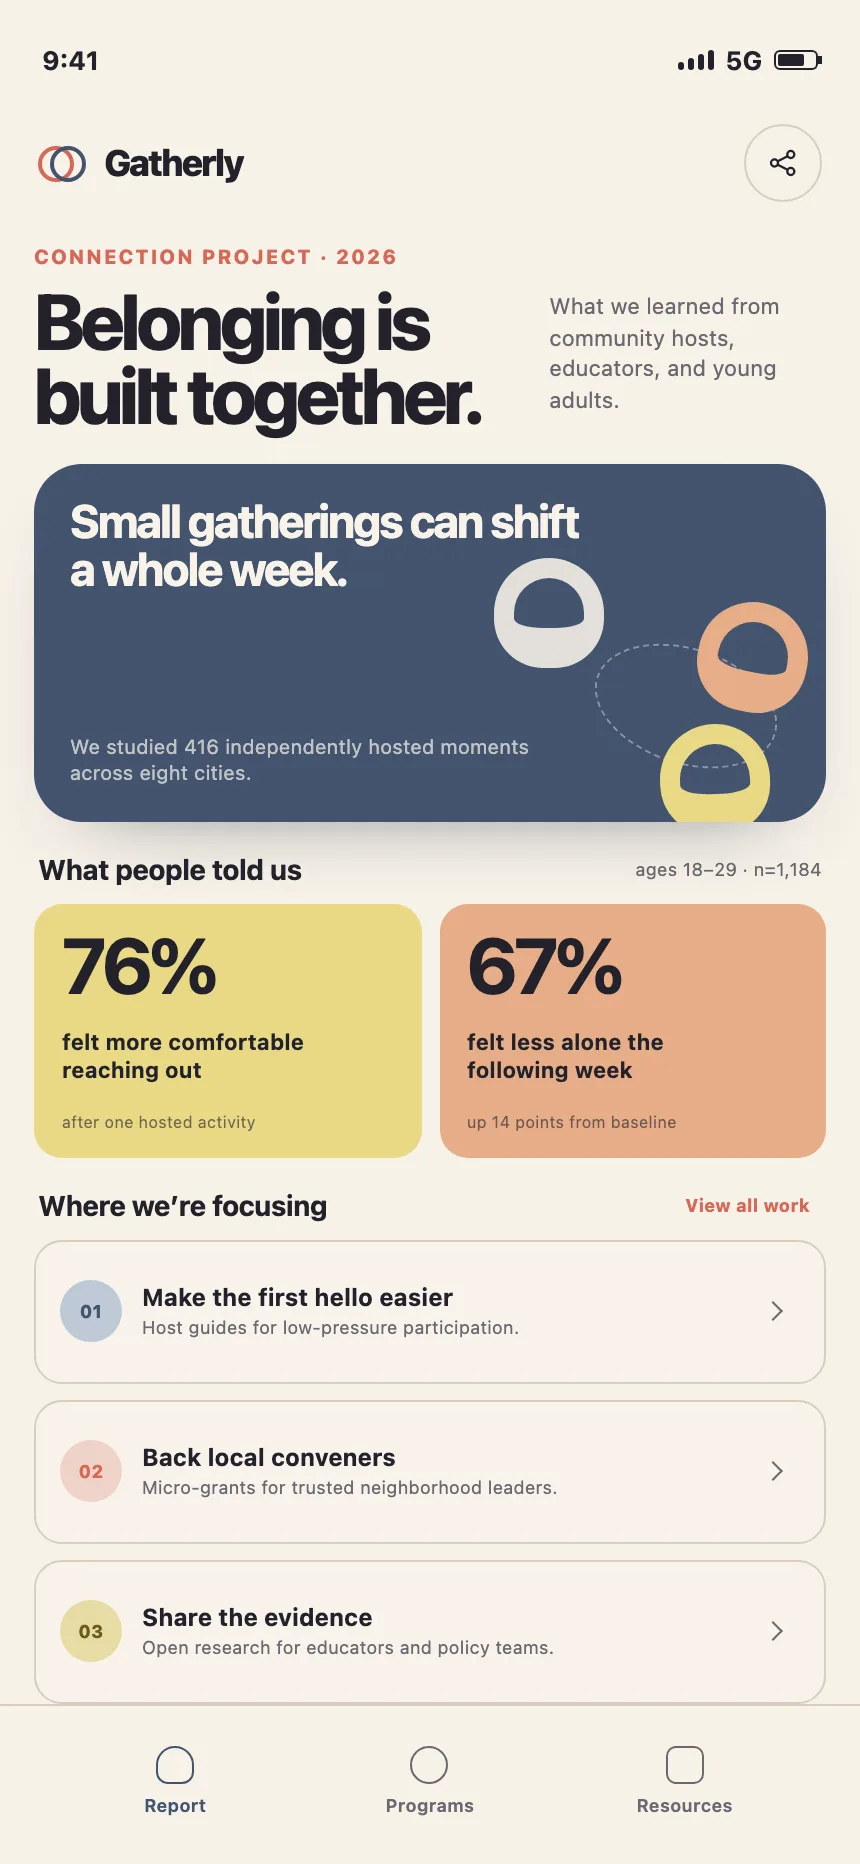
Each figure gets its own card or colored tile, laid out in a row or a two-by-two grid.


3. Stats beside a quote
A customer quote and the numbers behind it, so the figures have a face and the quote has proof.


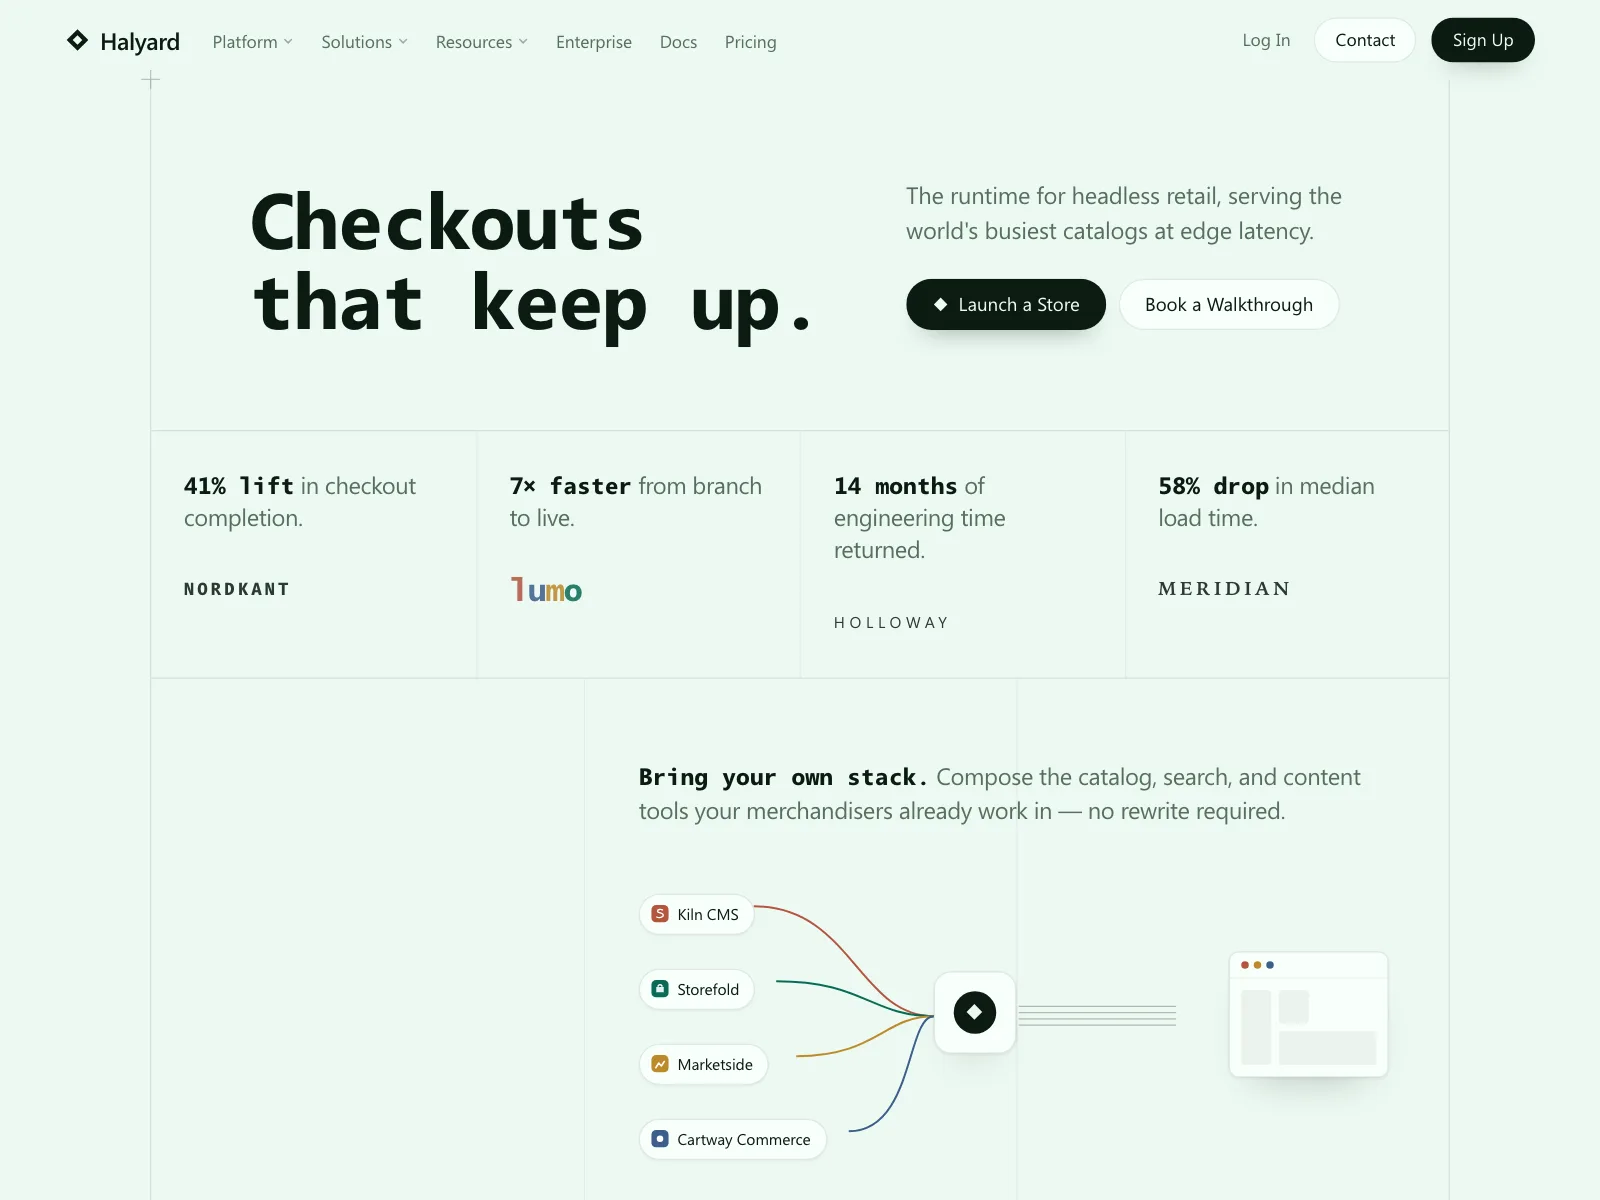
4. Results by customer
Each figure sits with a customer logo or a short case story, as a wall of named results.


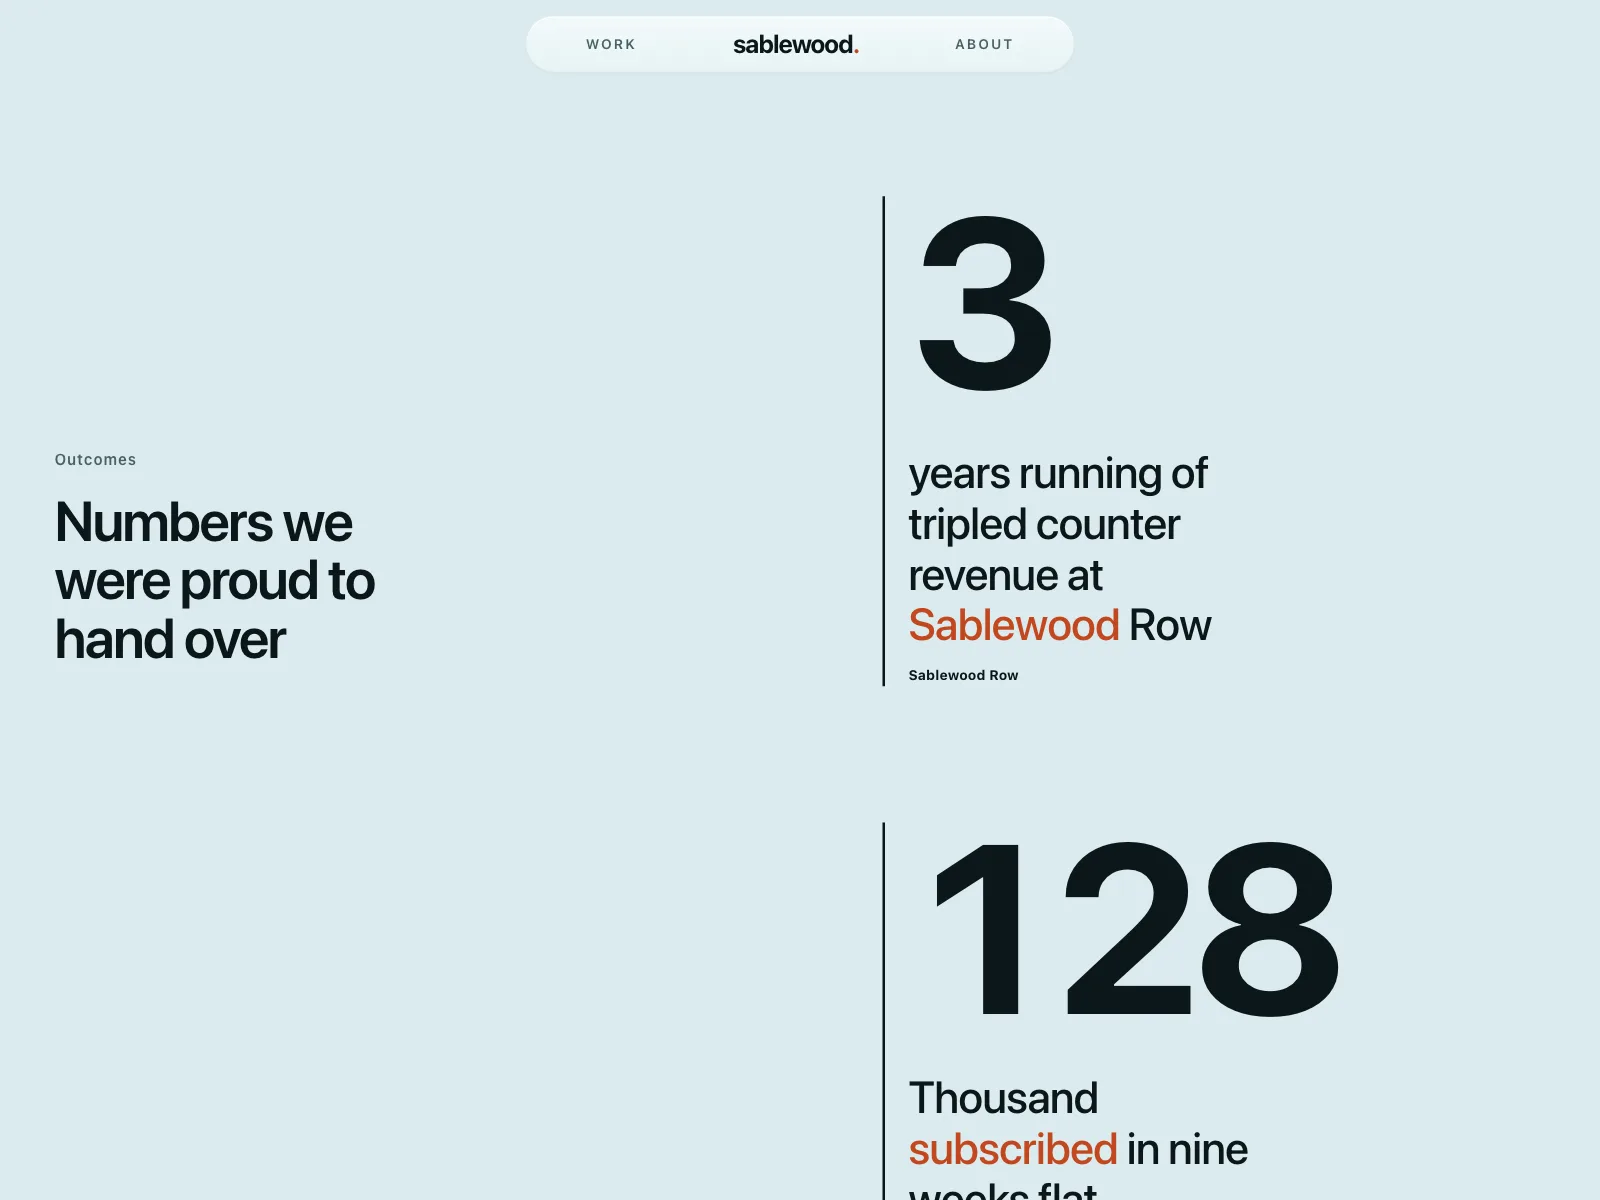
5. Oversized figures
Figures set as large as a headline, with small labels beside them, so the numbers carry the section on their own.


6. Stats with a chart
Headline figures paired with a small line or bar chart that shows the trend behind them.


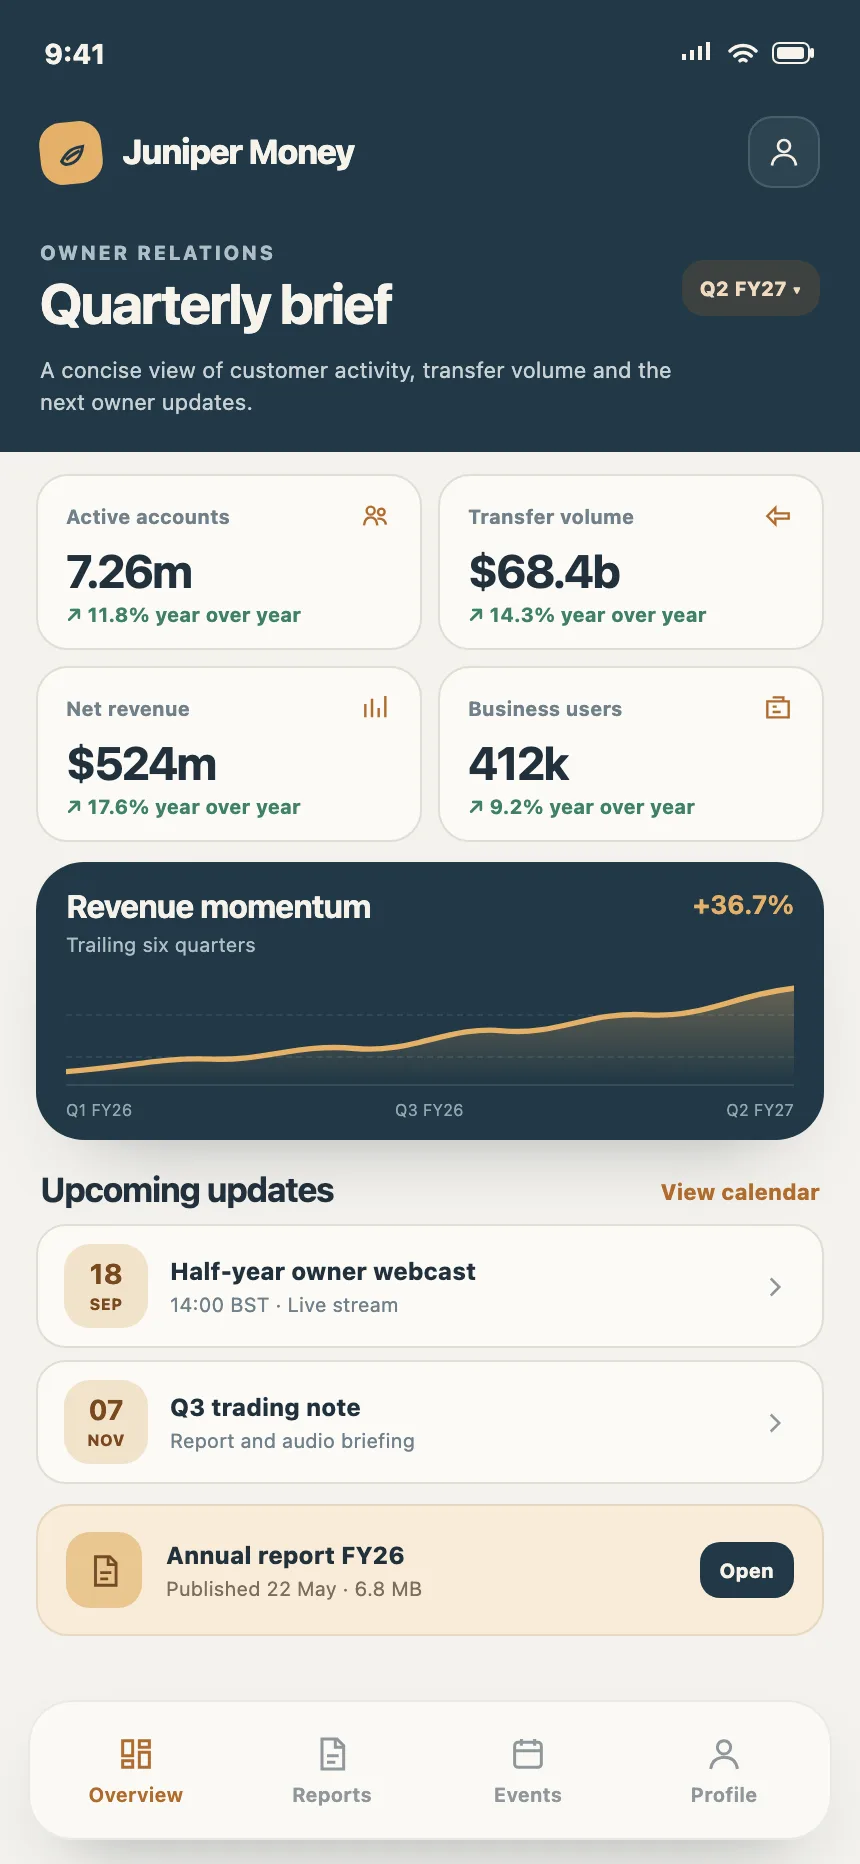
Where stats sections show up
Landing page proof
A row of figures right under the hero, before people scroll on to the features.


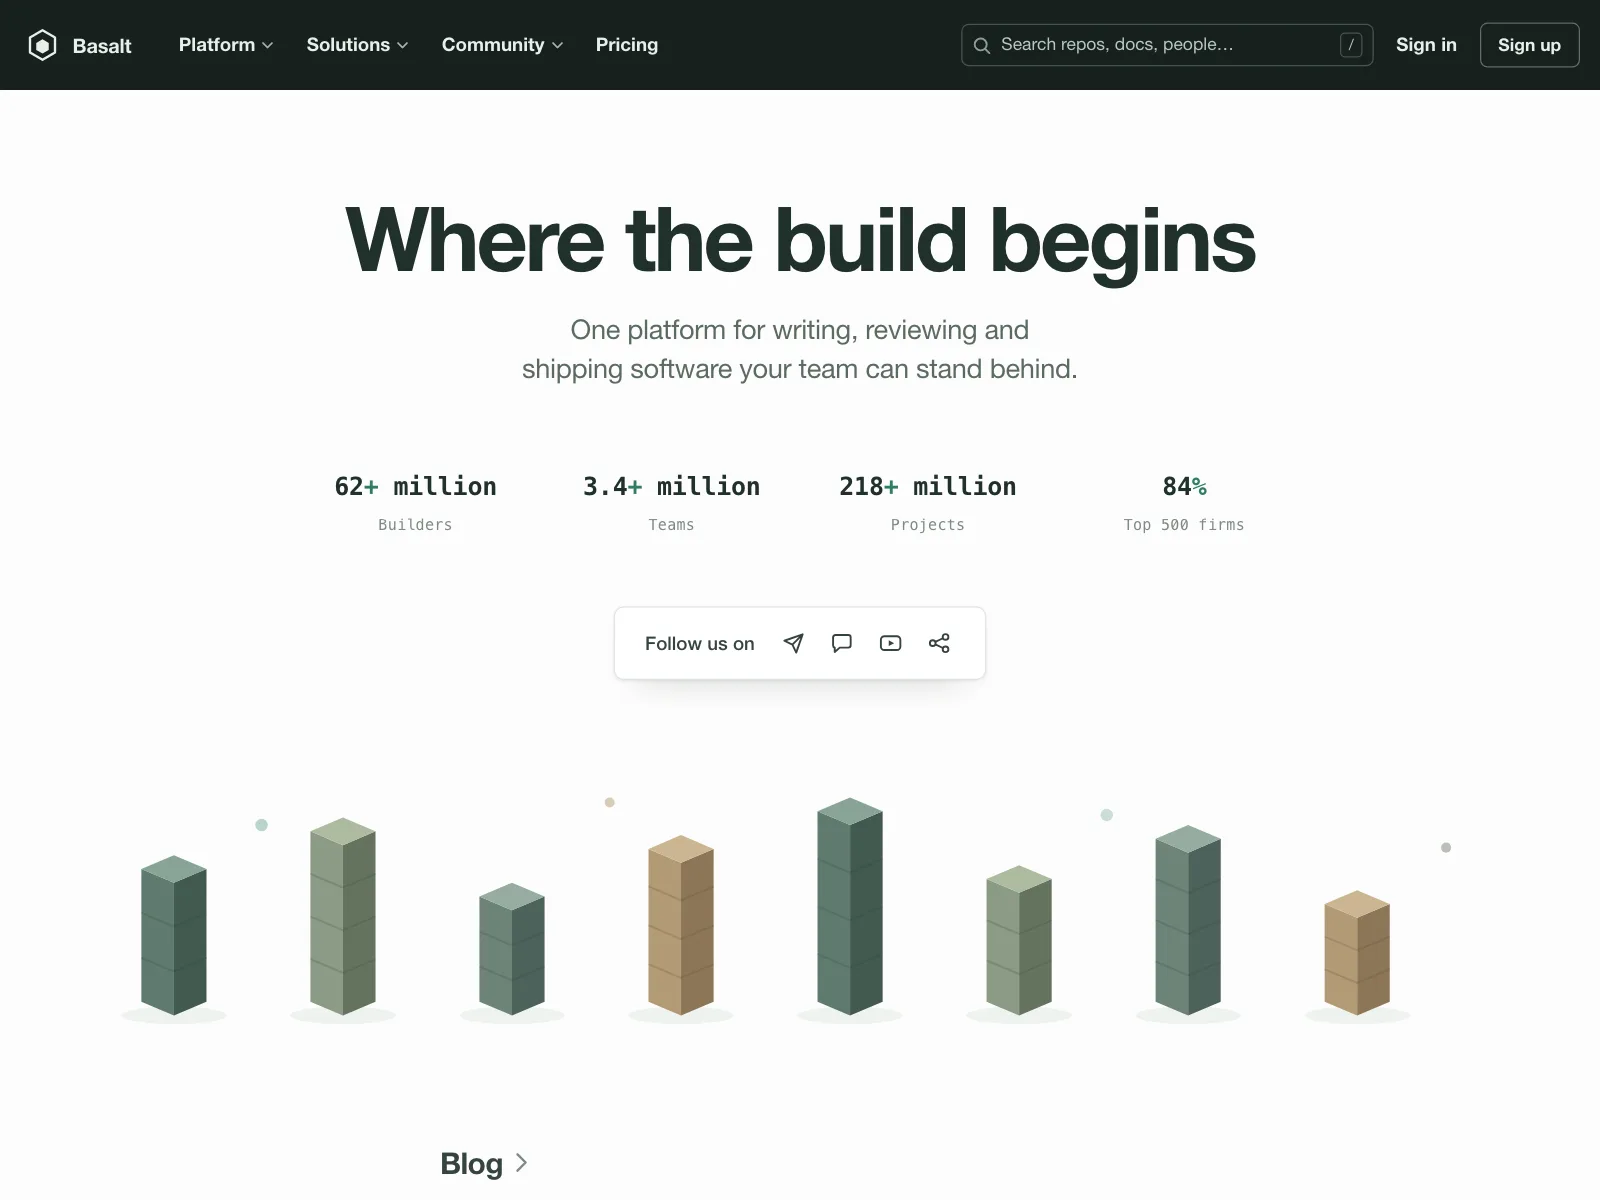
About pages
Founded, team size, funding and offices, as quick facts next to the company story.



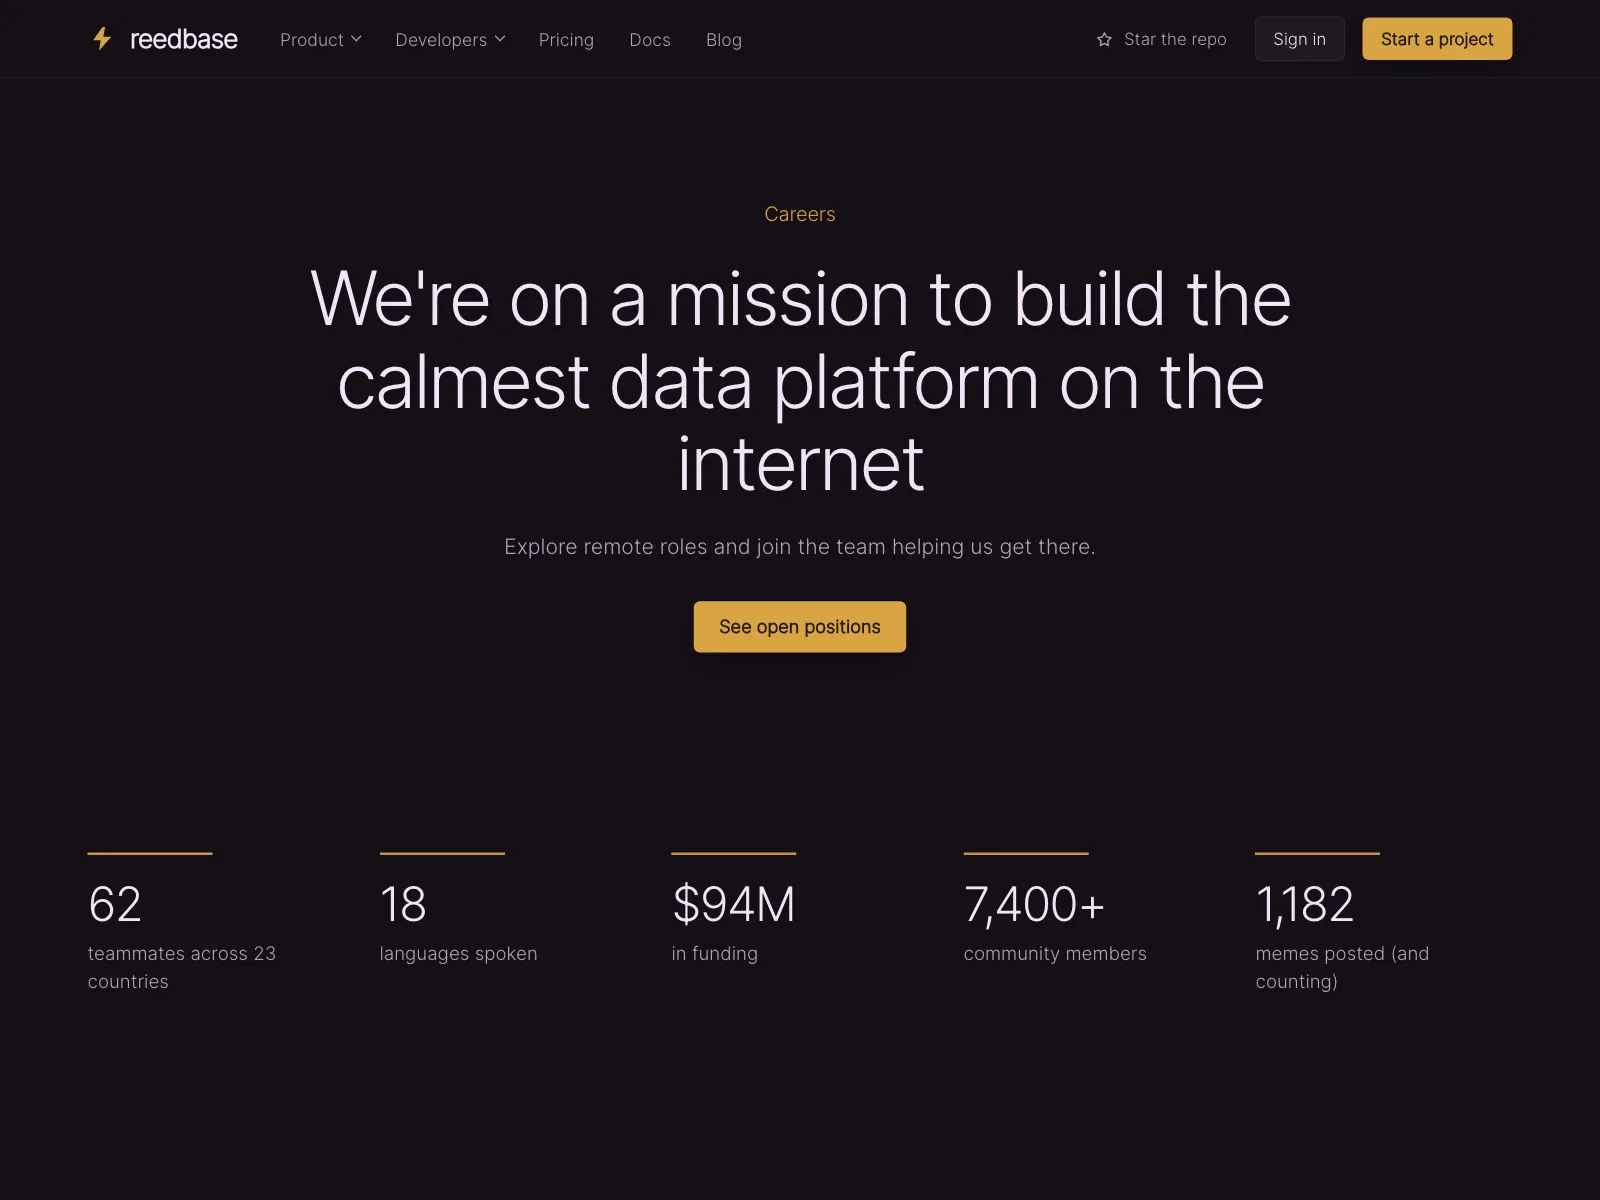
Careers pages
Team size, countries and languages, so candidates get a feel for the team.


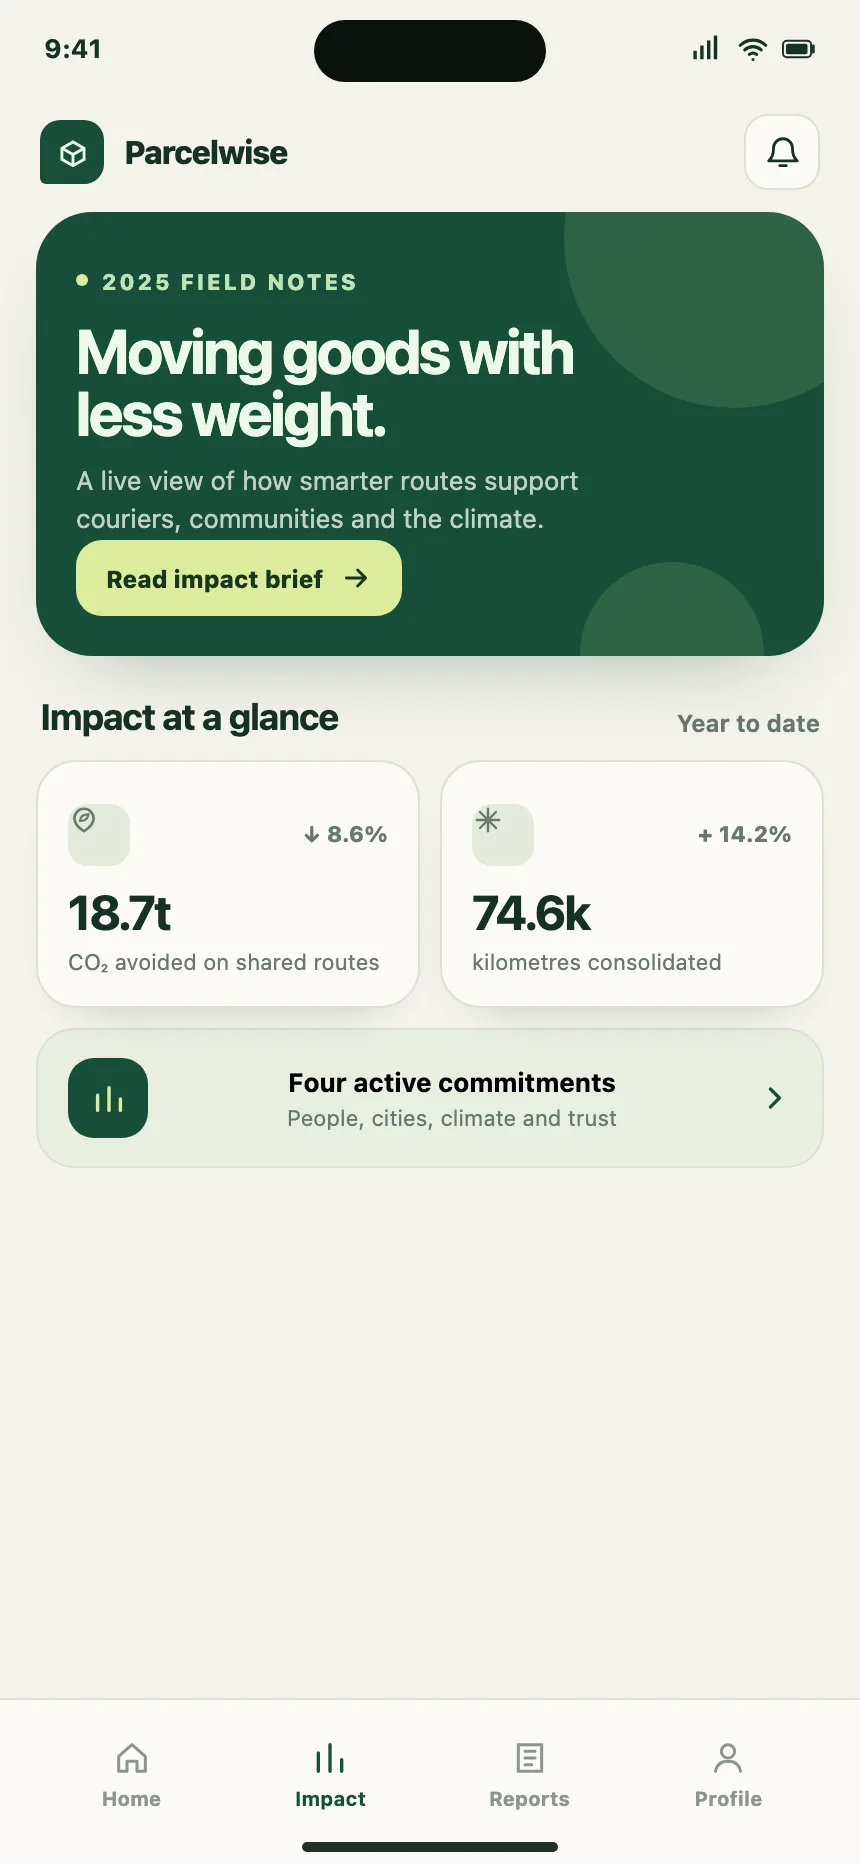
Reports and outcomes
Impact reports and studies that lead with their headline results.

Stats section vs similar components


Build notes
- Mark stats up as a <dl>: the label in <dt> and the figure in <dd>, with CSS putting the figure on top.
- Write the unit into the figure, like "4.8M km", and spell out any abbreviation in the label.
- Round big totals. 1.2M reads faster than 1,204,388.
- Date the figures or footnote their source, so every claim can be checked.
- Set figures in tabular numbers (font-variant-numeric: tabular-nums), so digits keep their width.
- If figures count up, skip the animation under prefers-reduced-motion and give screen readers only the final value.
FAQ
How many stats should a stats section show?
Three or four, which is the usual count in the Kombai gallery. Each extra figure makes the others harder to remember, so cut the weakest one before adding another.
Should stat numbers animate?
They can, but it is optional. A short count-up draws the eye once. Run it once, keep it short and show the final number straight away for people who turn on reduced motion.
Exact or rounded numbers?
Round big totals: 1.2M rides reads faster than 1,204,388. Keep exact figures for small, precise claims, like 99.95% uptime or a 14-minute average.
What makes a stat believable?
A clear label, a unit, a date and a source. "1.2M rides this year, from our ride logs" says more than "1M+ happy customers".
Related terms
All glossary terms · Browse 136 web and 38 mobile stats section designs