
Charts
Charts turn numbers into lines, bars and slices, so people can see trends, comparisons and parts of a whole at a glance.
- Also called
- graph, data visualization
- Platforms
- Web, Mobile
- In the gallery
- 250 web and 165 mobile designs
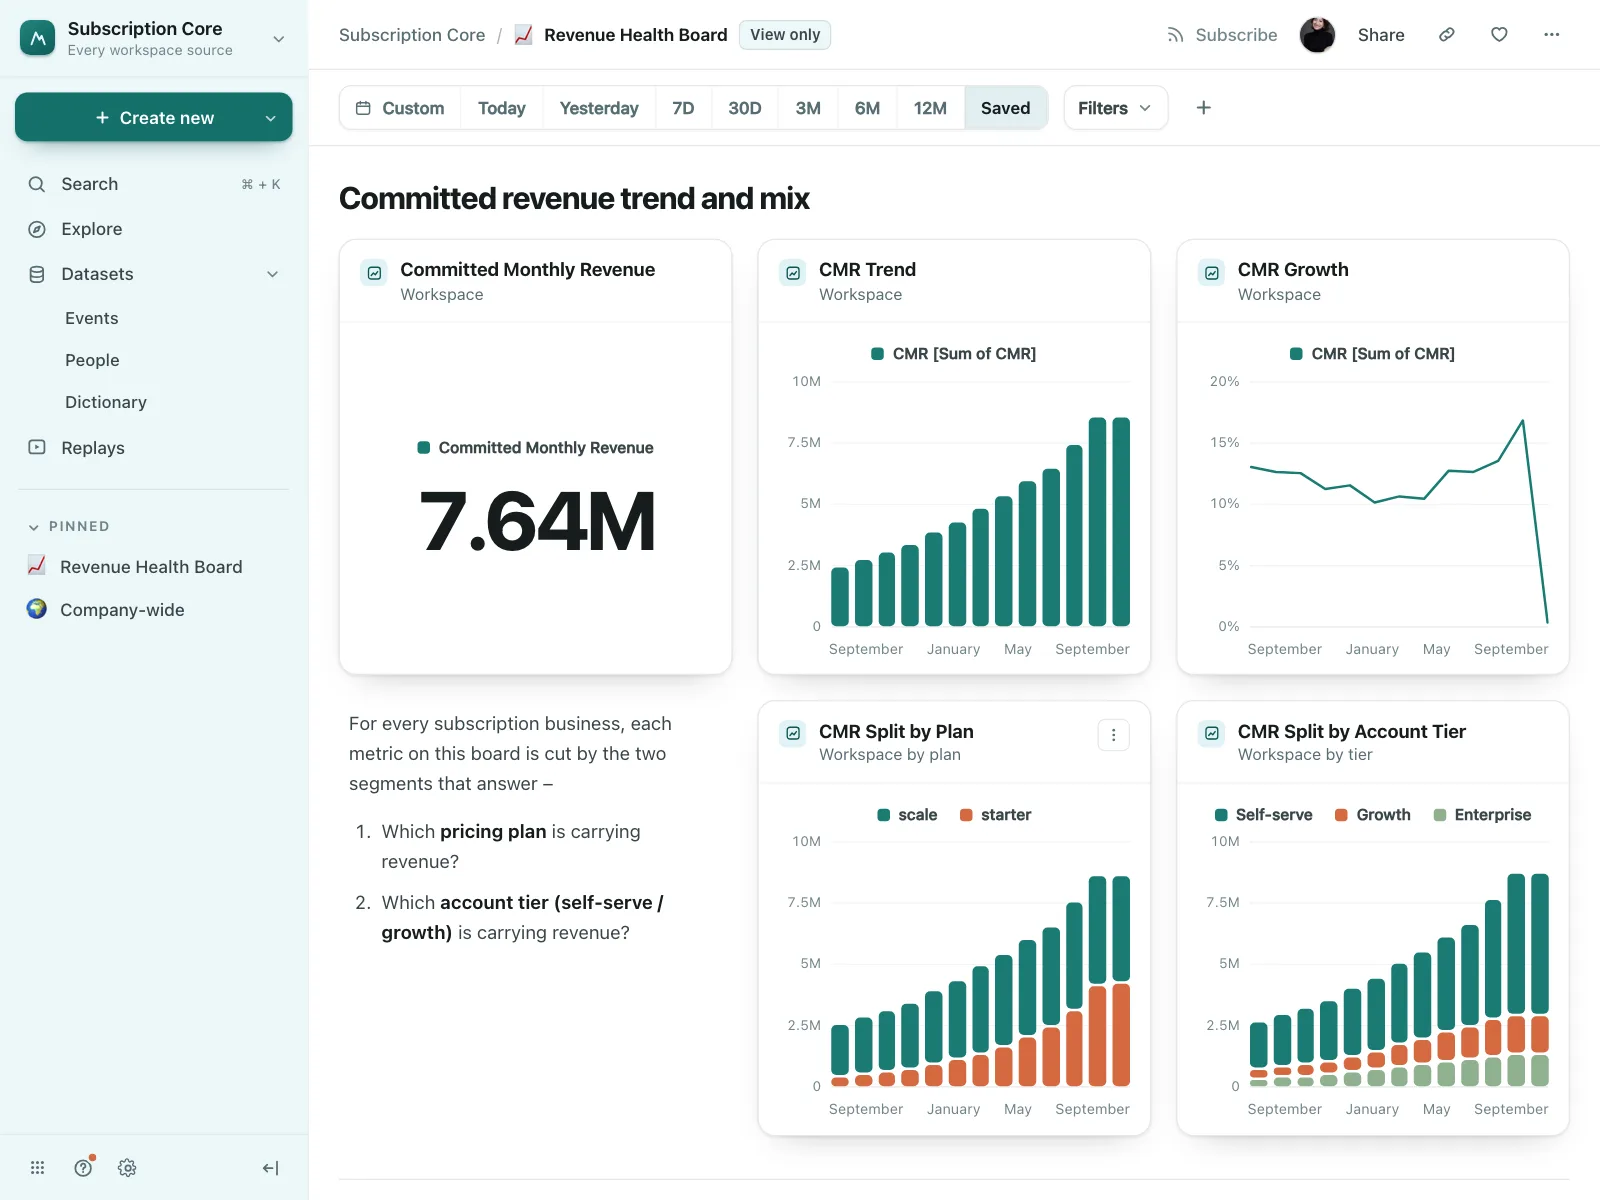
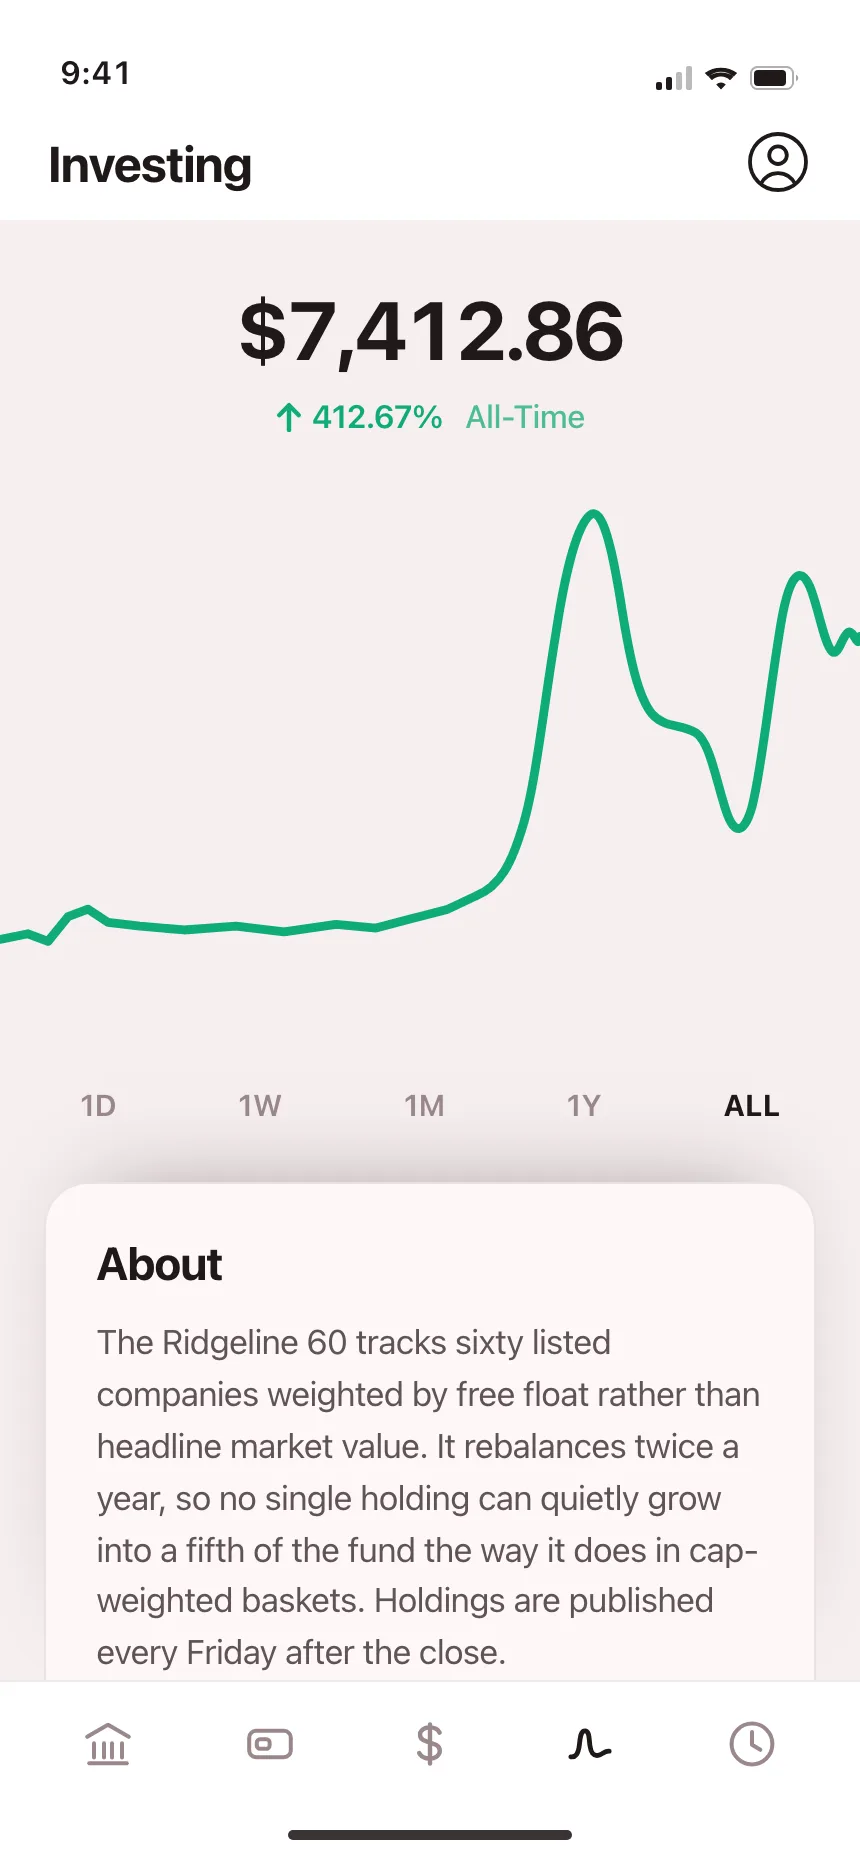

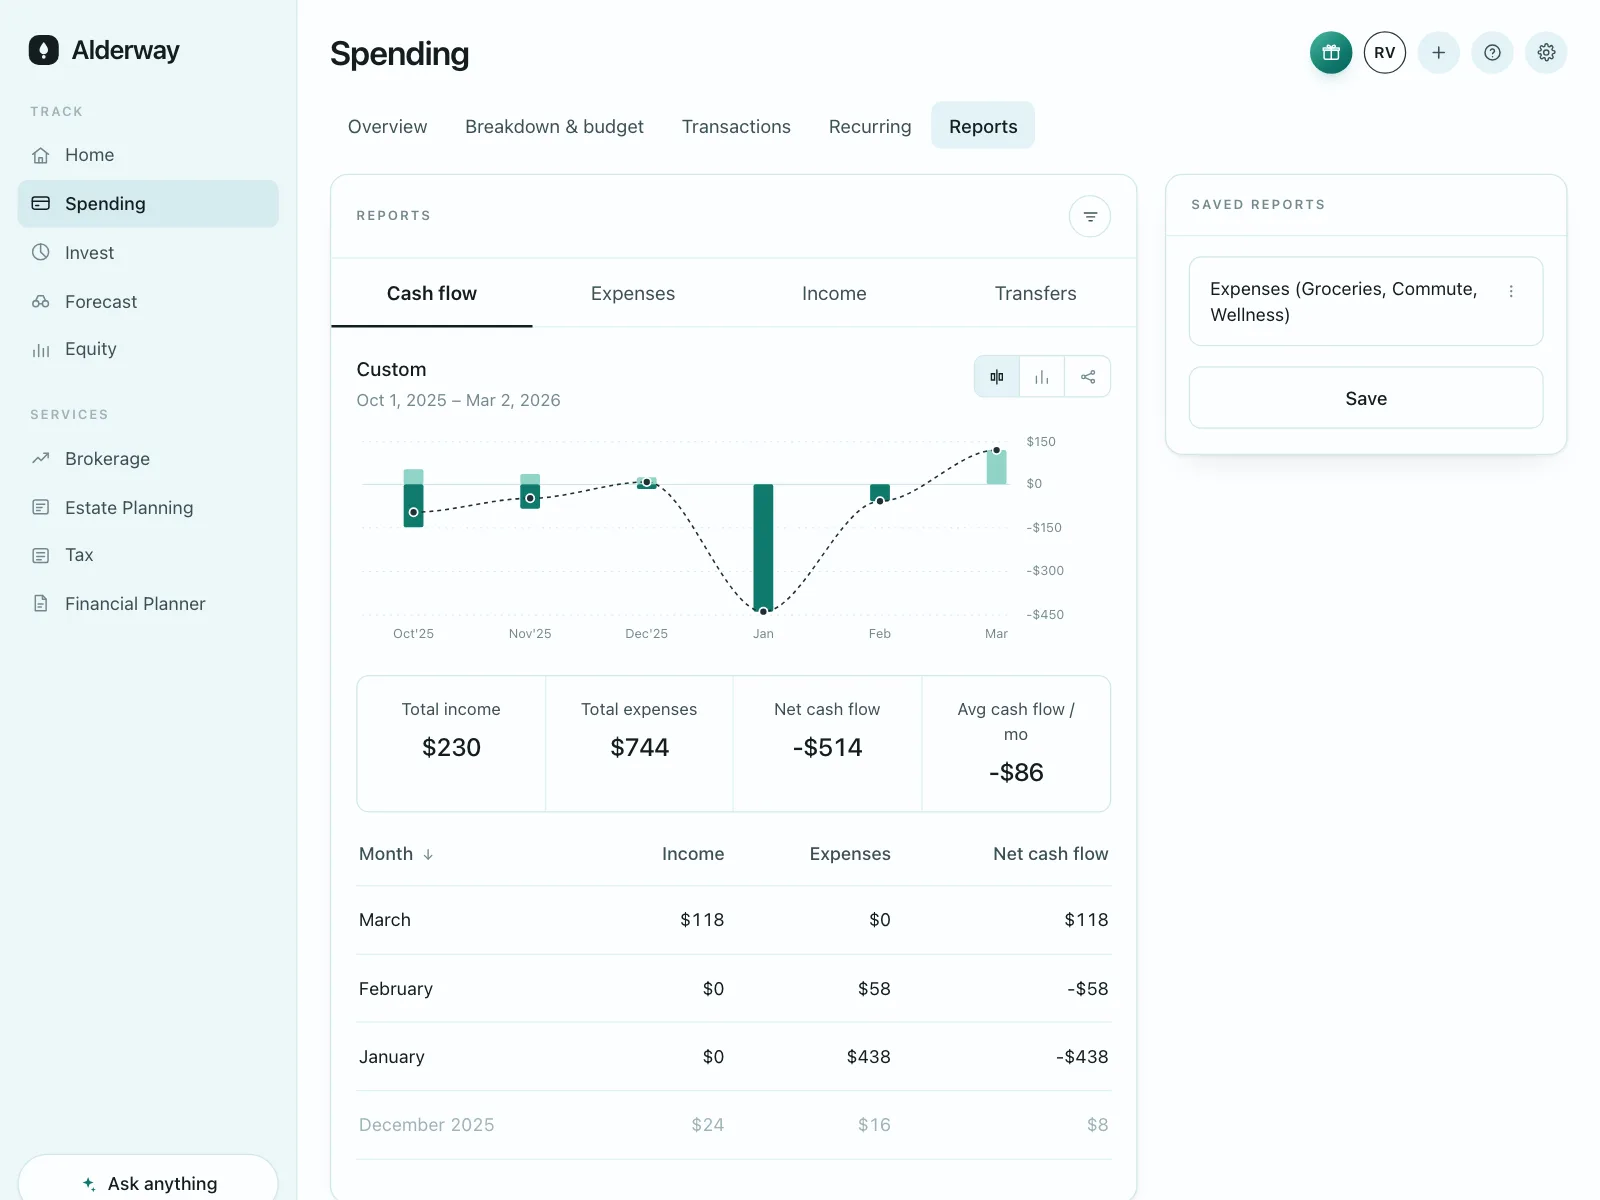
Charts from the Kombai gallery: a product analytics tool's revenue board, an investing app's fund performance and a training log's weekly sessions.
What are charts?
Charts are graphics that show numbers as position, length, angle or area, so patterns stand out before anyone reads a value. A line shows change over time, bars compare amounts, and a donut splits one whole into parts.
- Axes, gridlines and a legend tell people how to read the marks.
- A title says what is measured, and a tooltip gives the exact values.
Charts show up across dashboard, widget, CRM and wallet screens.
When to use a charts
- Trends over timeVisits, prices or sleep across days, weeks or years.
- ComparisonsSpend by category or sales by month, side by side.
- A takeaway at a glanceThe shape of the data matters more than any one value.
When not to use one
- Exact values matterIf people look up or copy numbers, use a table.
- A single numberOne figure reads faster as a big stat than as a chart.
- Too many seriesPast a handful of lines or slices, a chart turns to noise. Split it.
Anatomy of a charts
This one works. Hover the chart, or tab to it and use the arrow keys. Switch to the table to read the same numbers.
- Loading
- Empty
- Hover
- Keyboard focus
- TitleNames the measure and period
- AxesScale, labels and gridlines
- SeriesThe lines, bars or slices
- LegendNames and toggles each series
- TooltipExact values on hover or focus
- StatesLoading, empty, hover, focus
Charts variants
We sorted every chart design in the Kombai gallery and found six patterns. Browse all 250 web and 165 mobile designs.
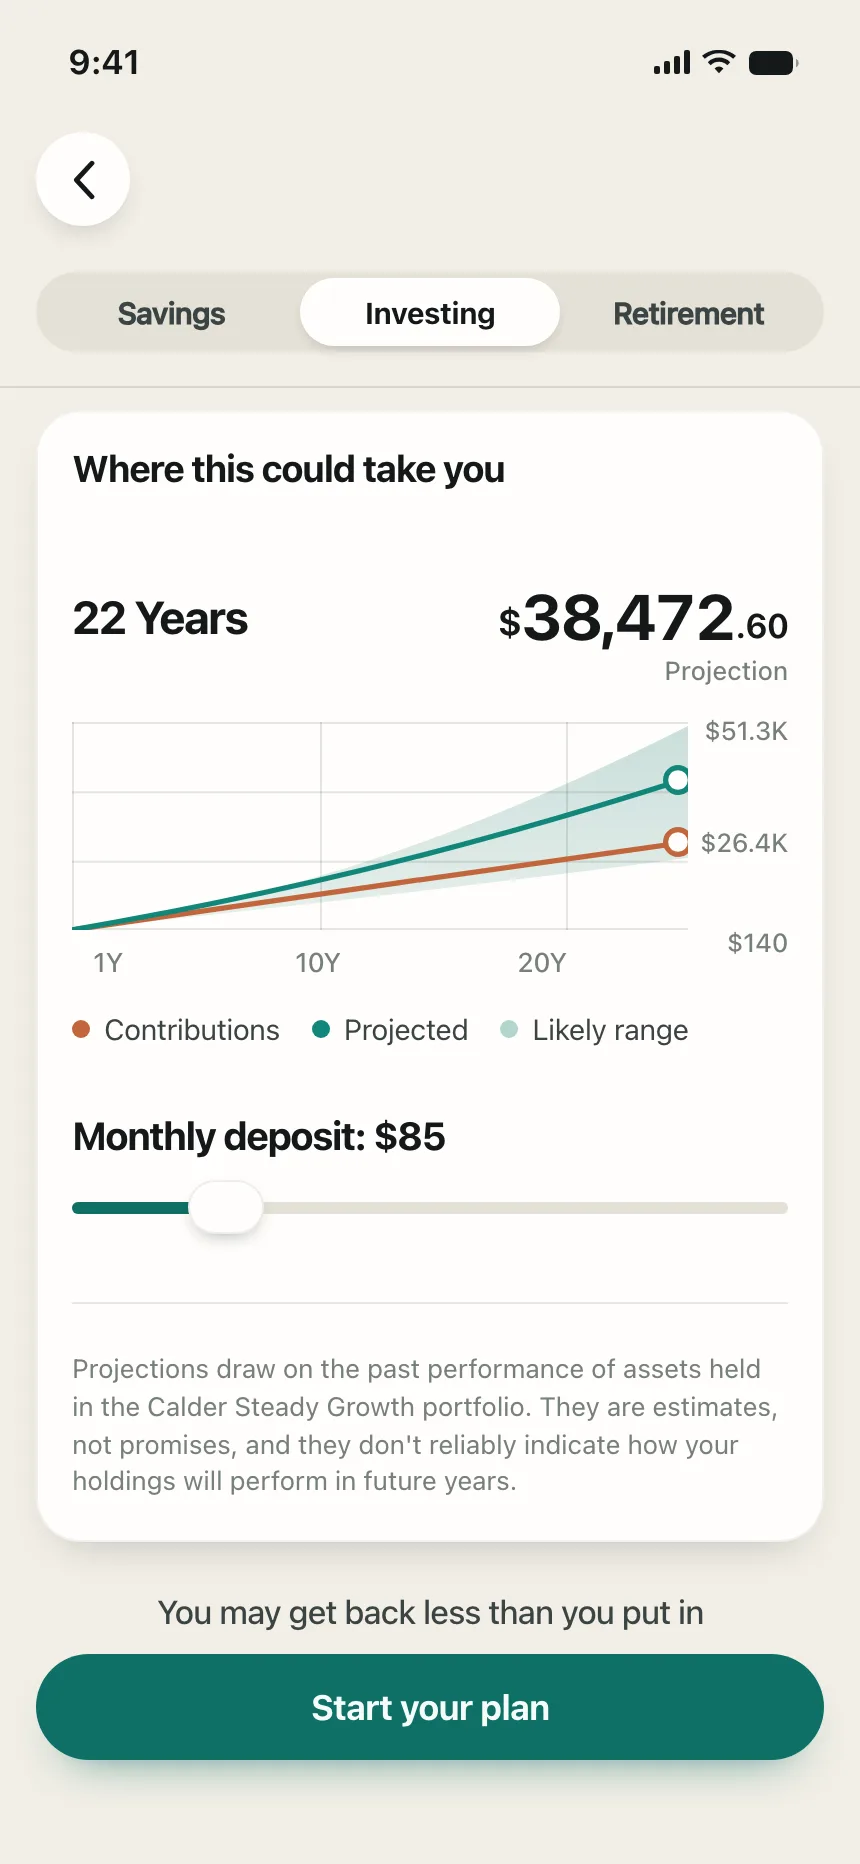
1. Line and area charts
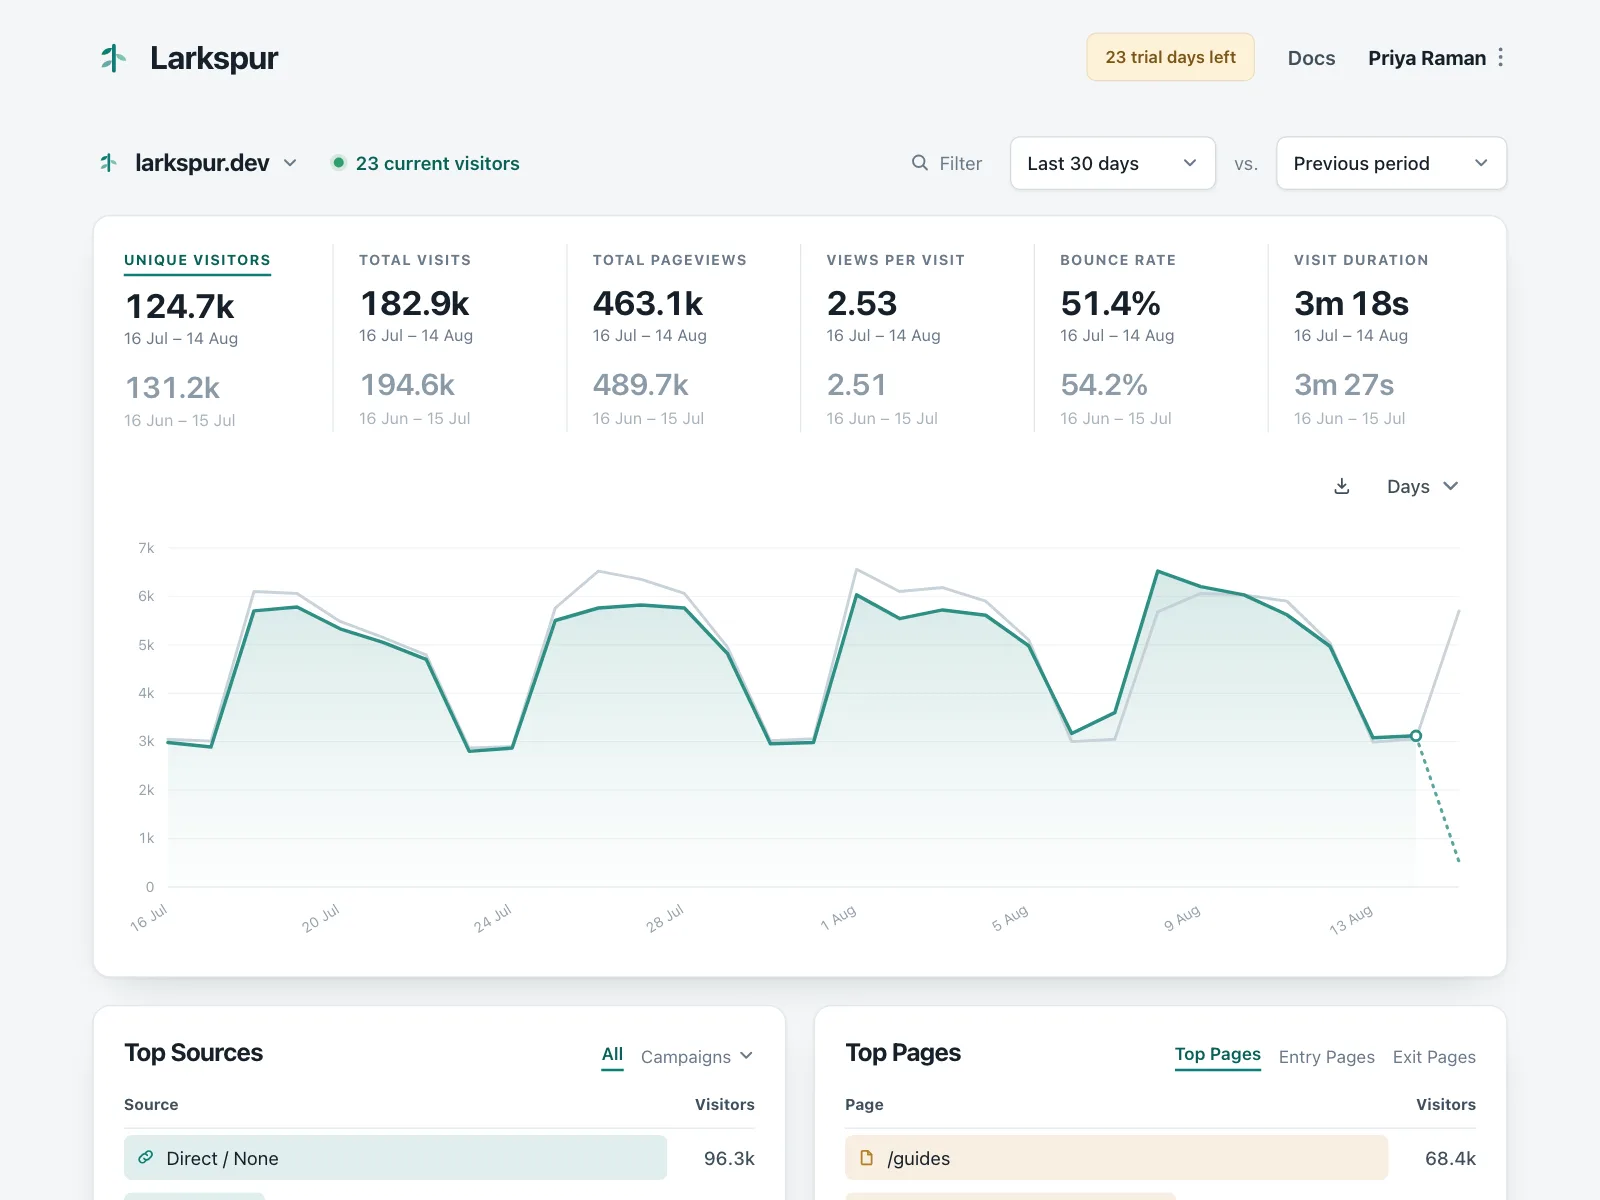
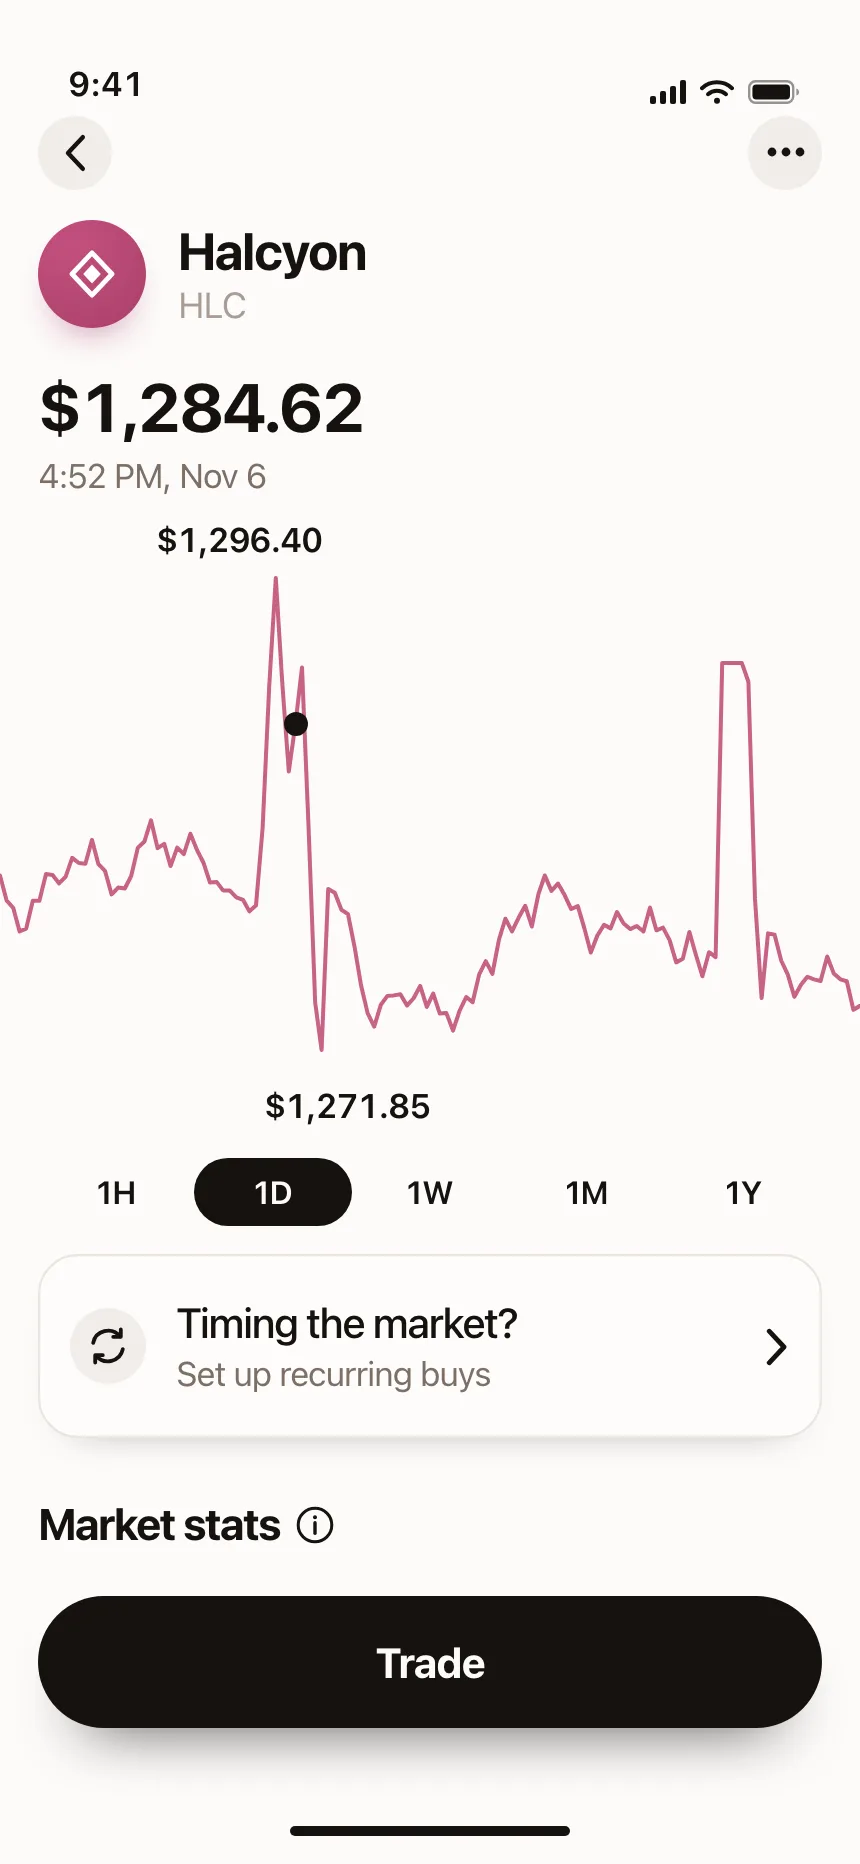
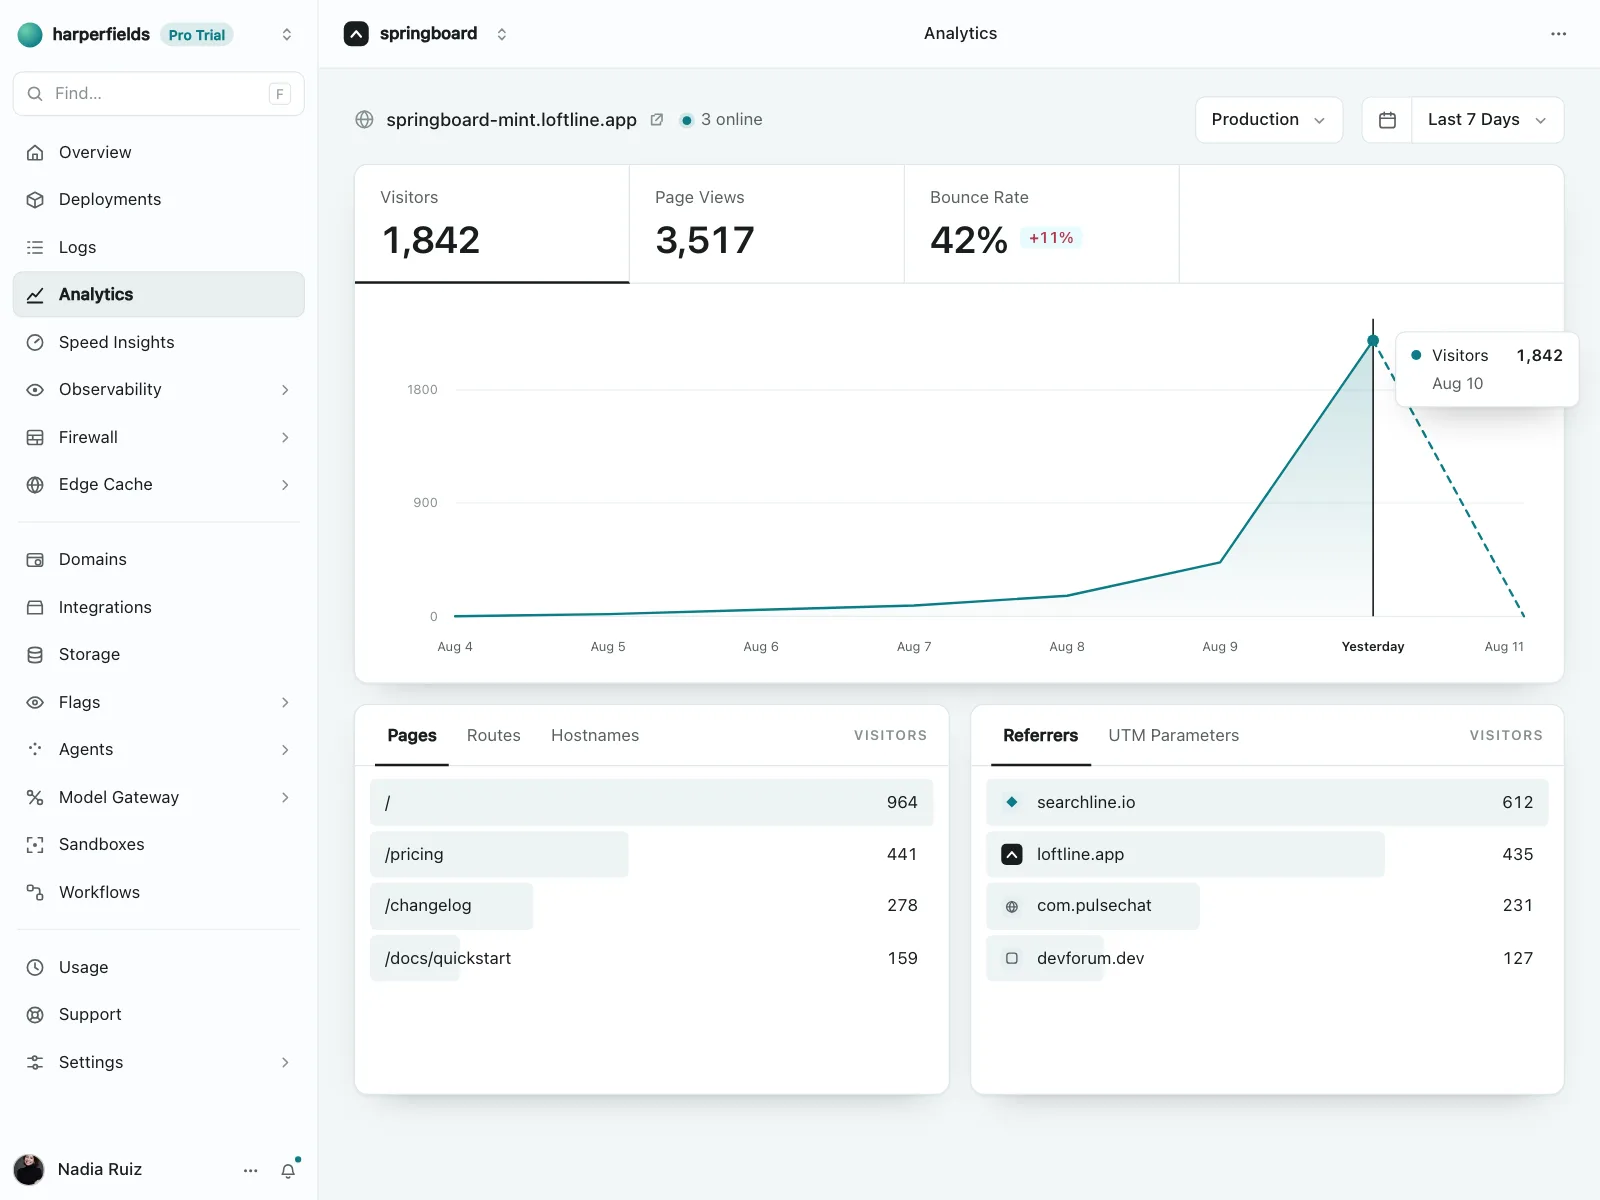
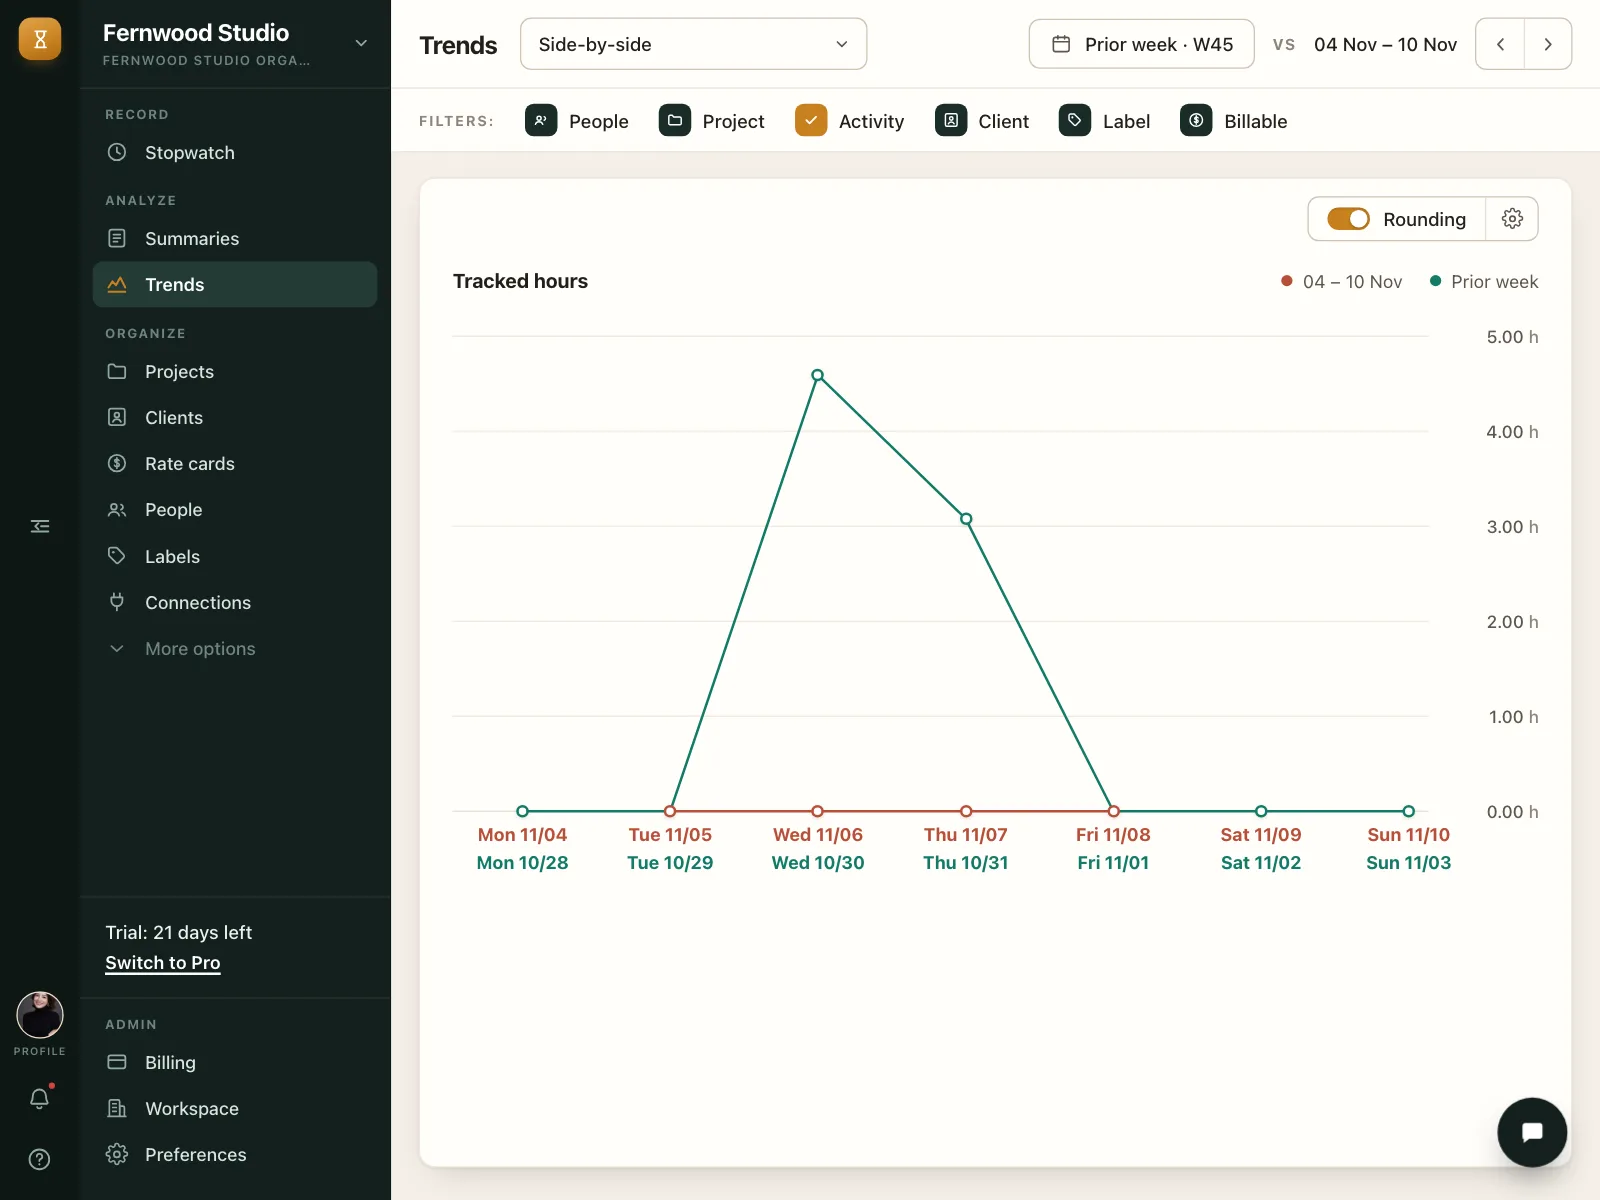
The default for change over time, like a price, a balance or daily visitors. An area fill under the line shows volume.
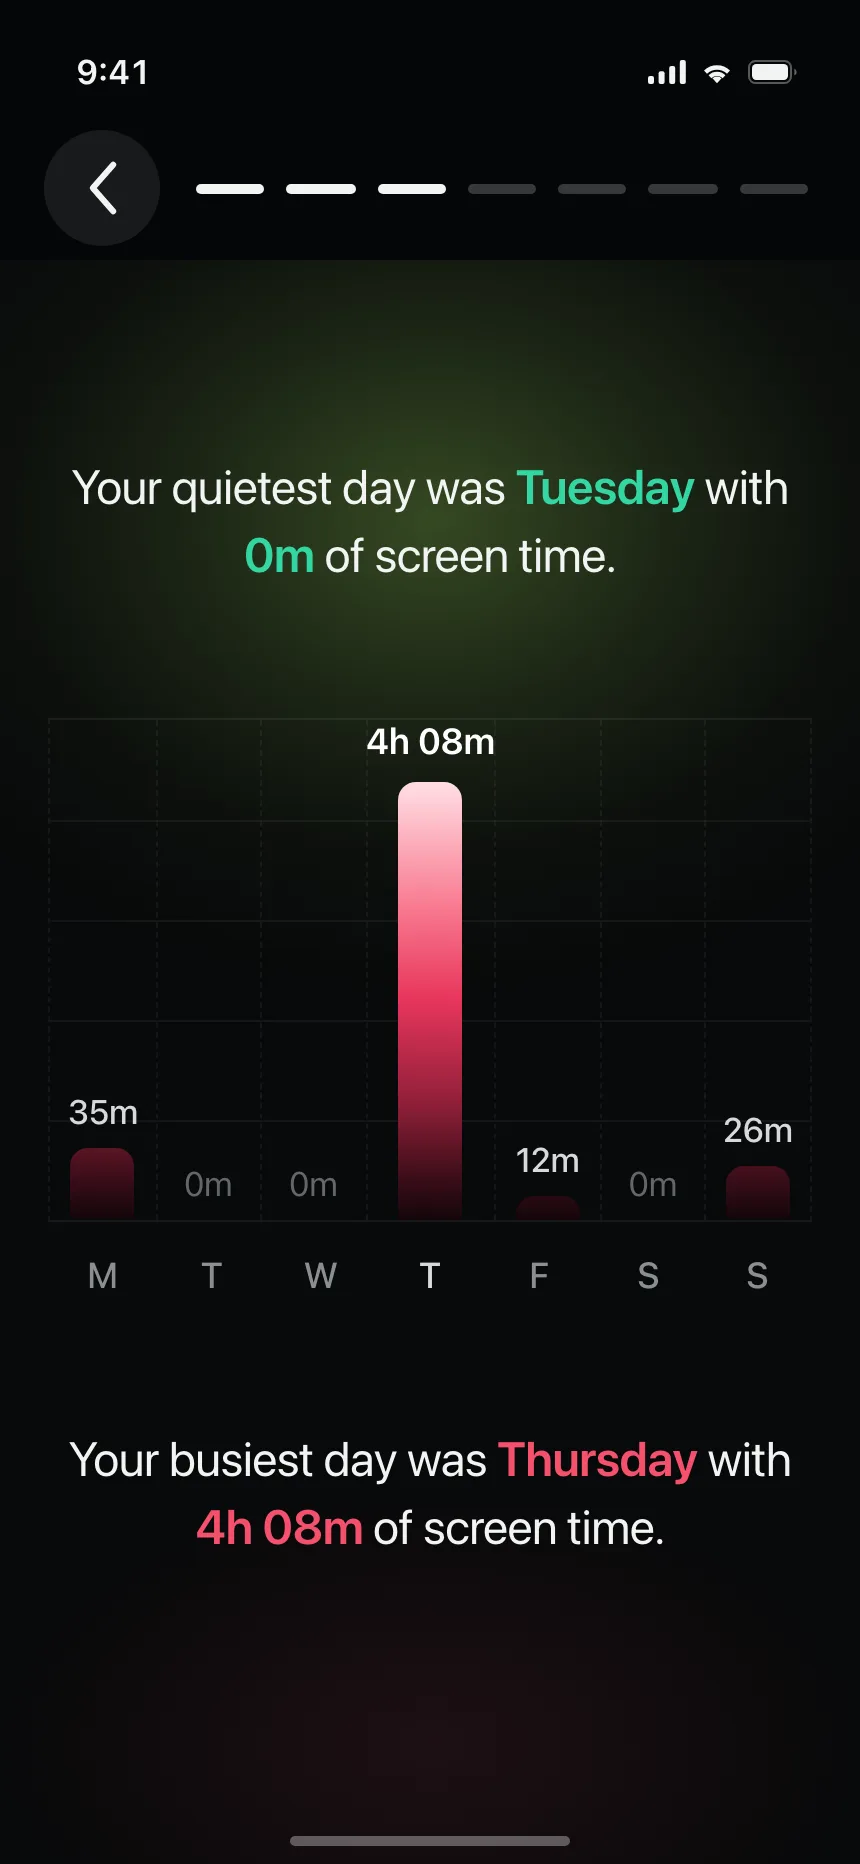
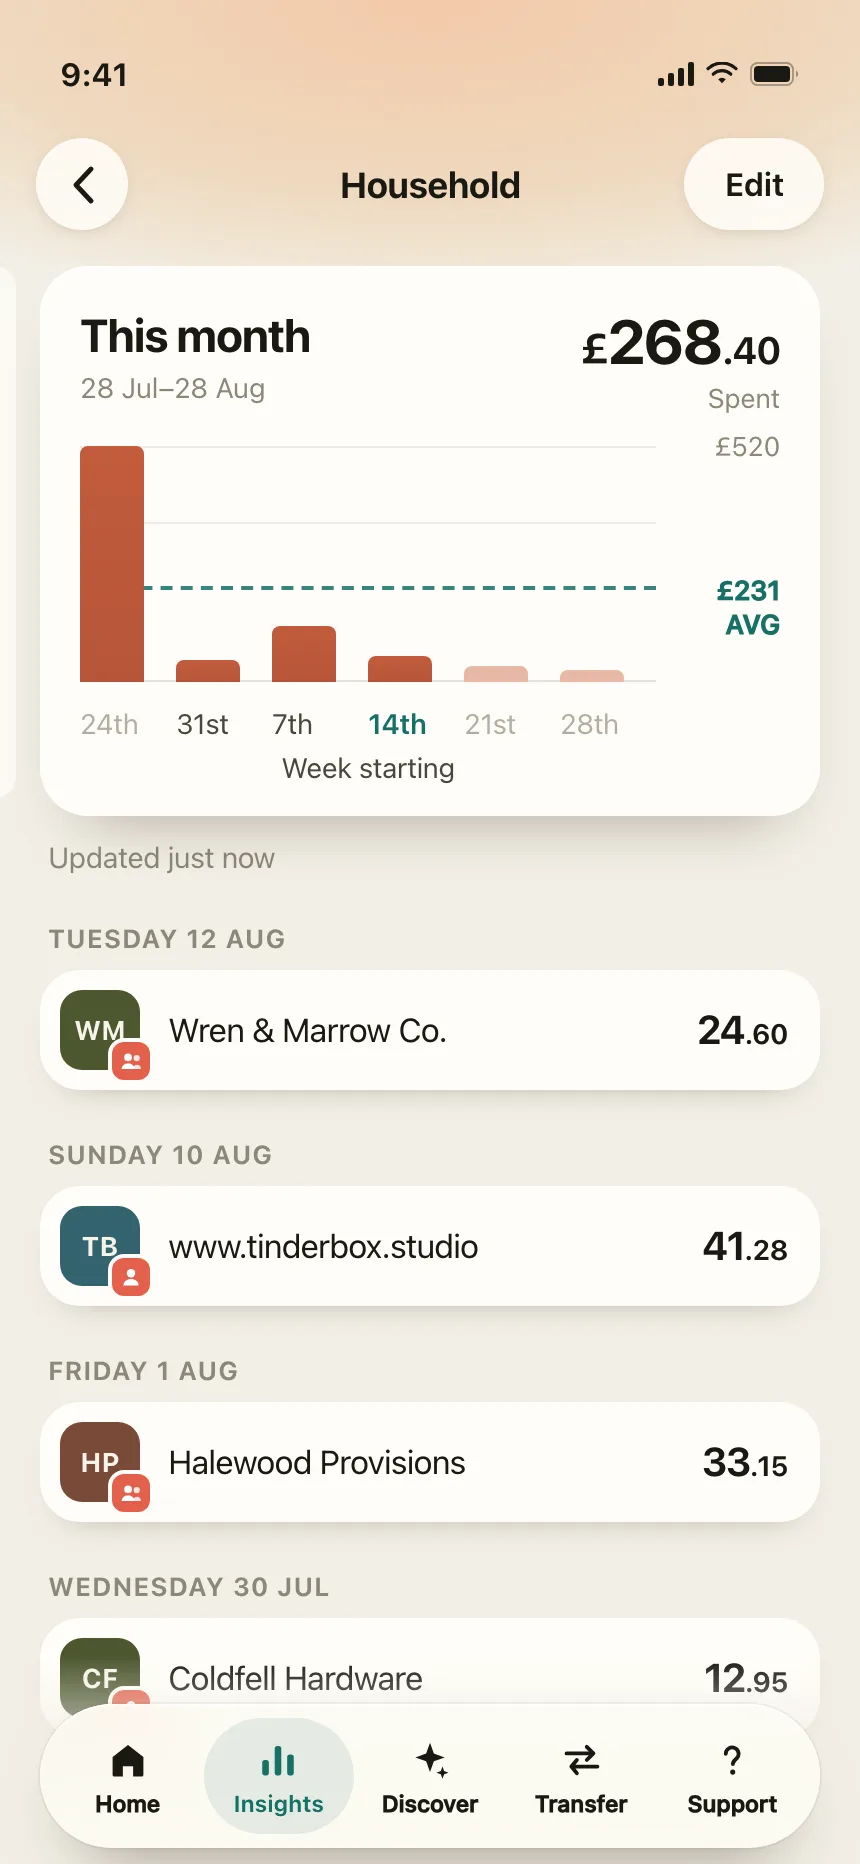
2. Bar and column charts
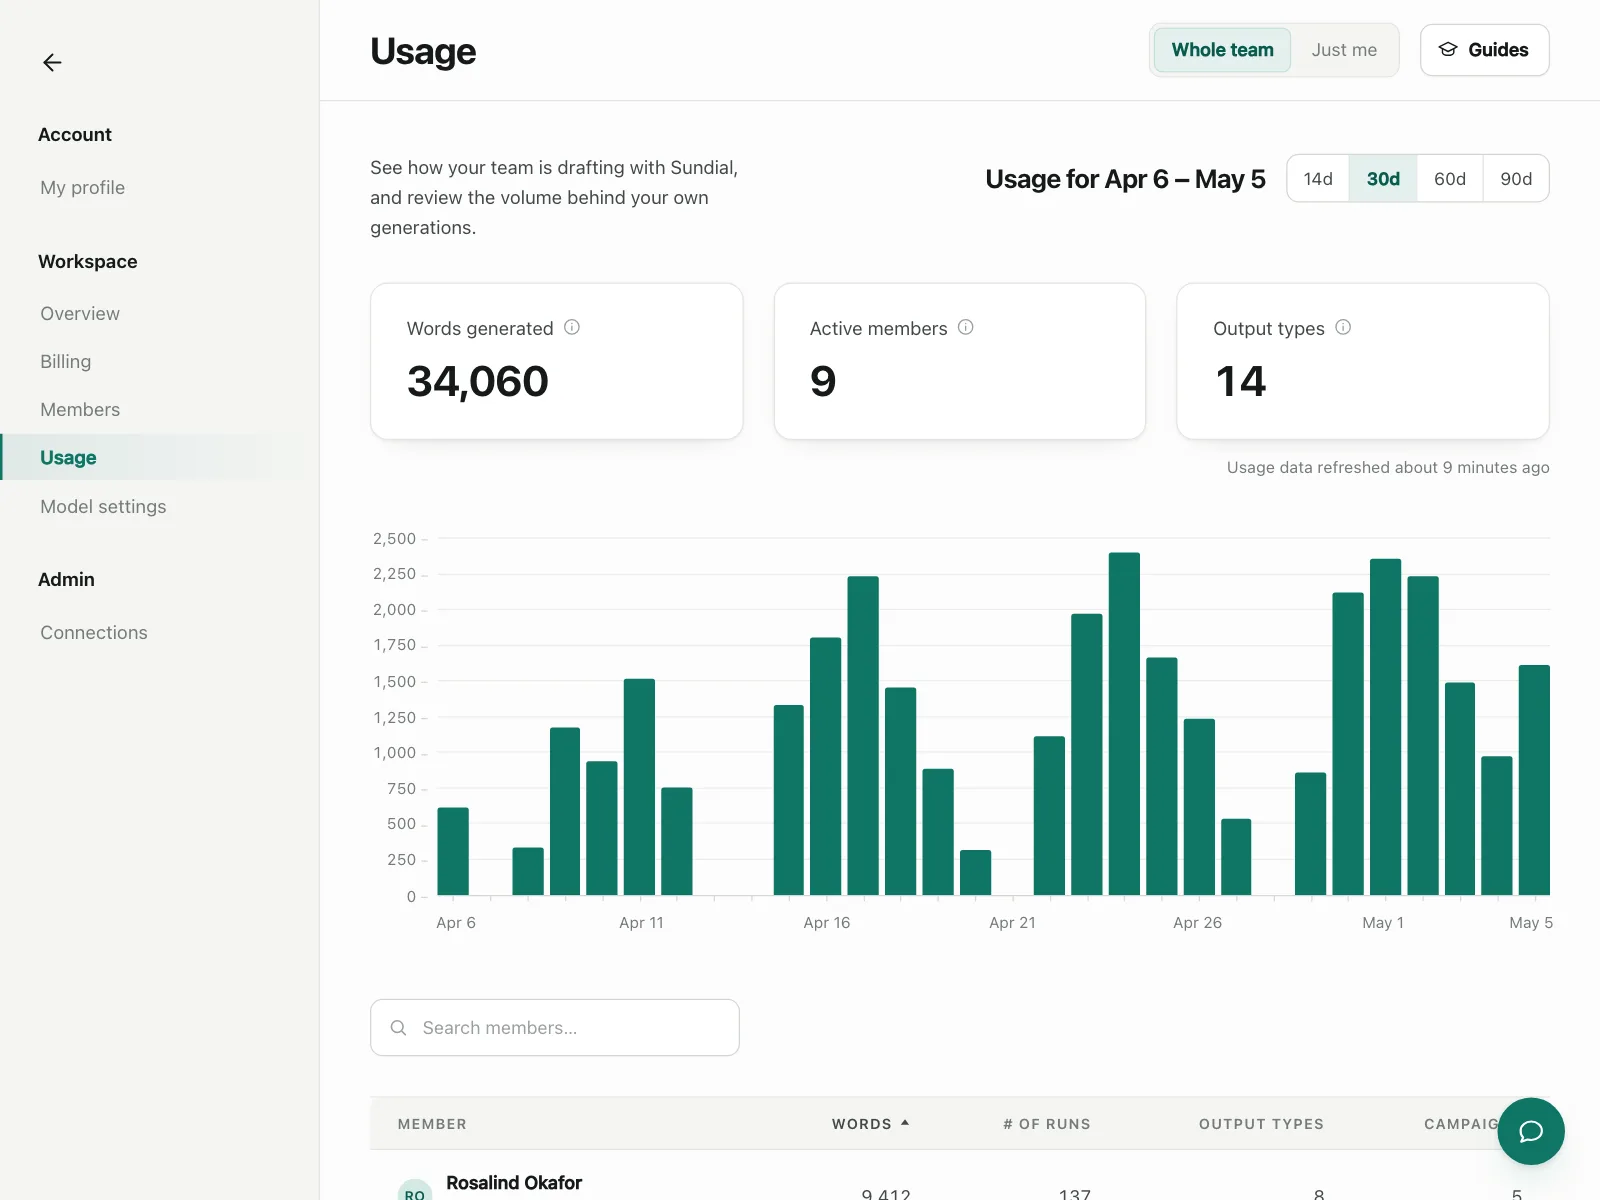
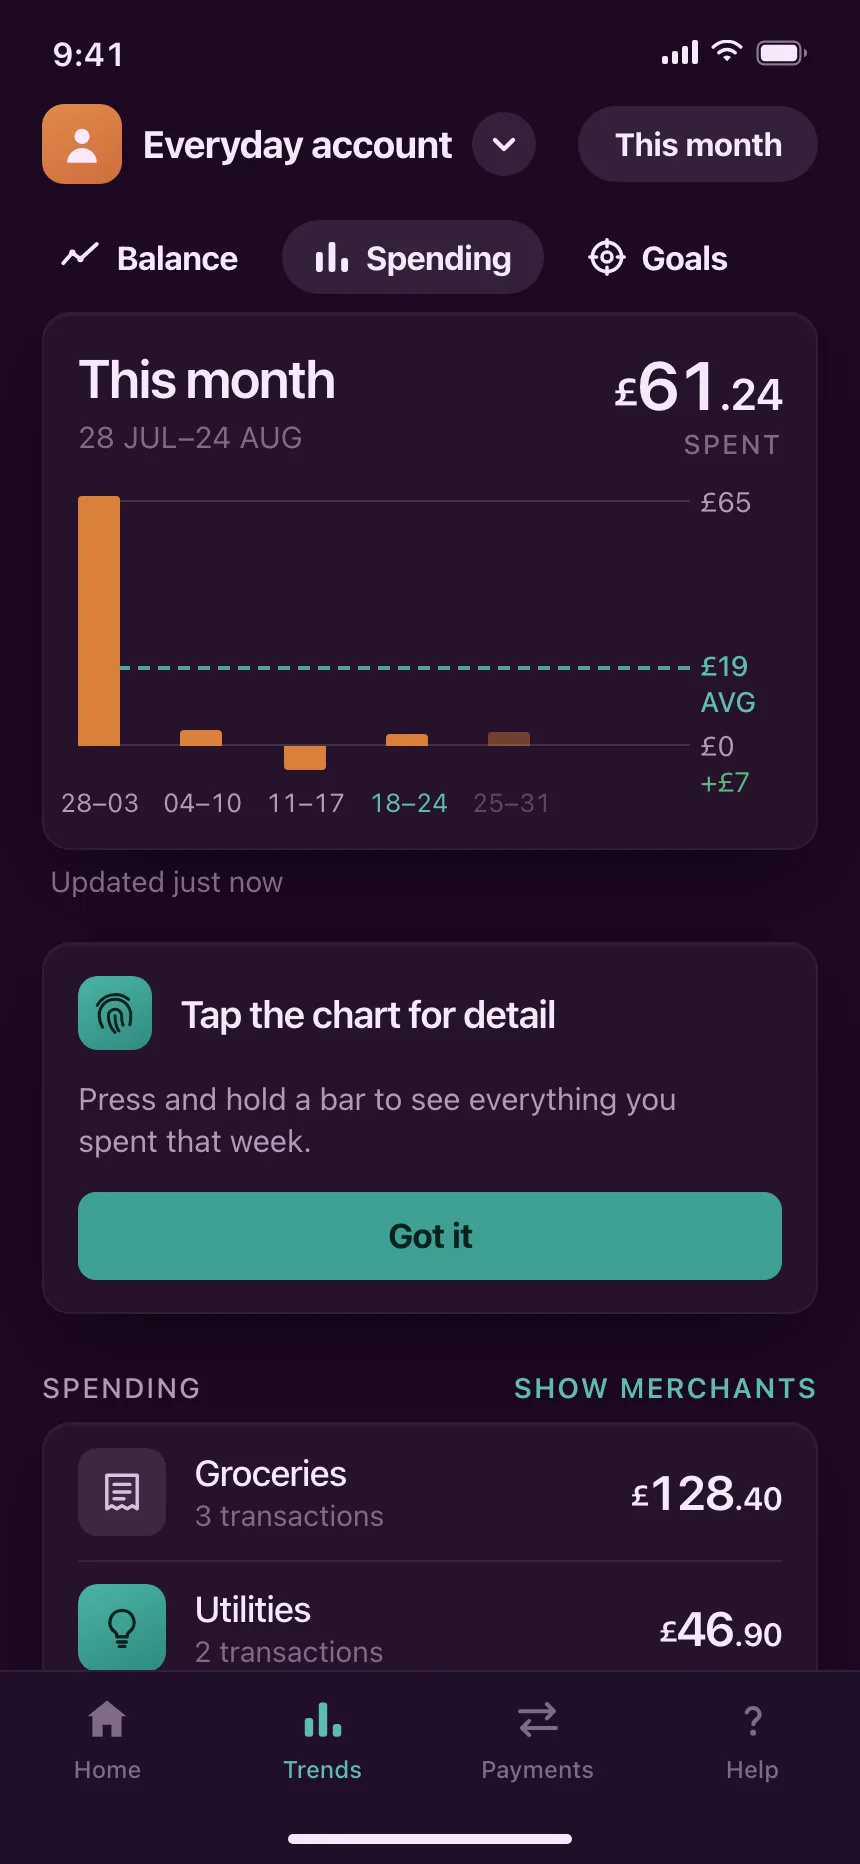
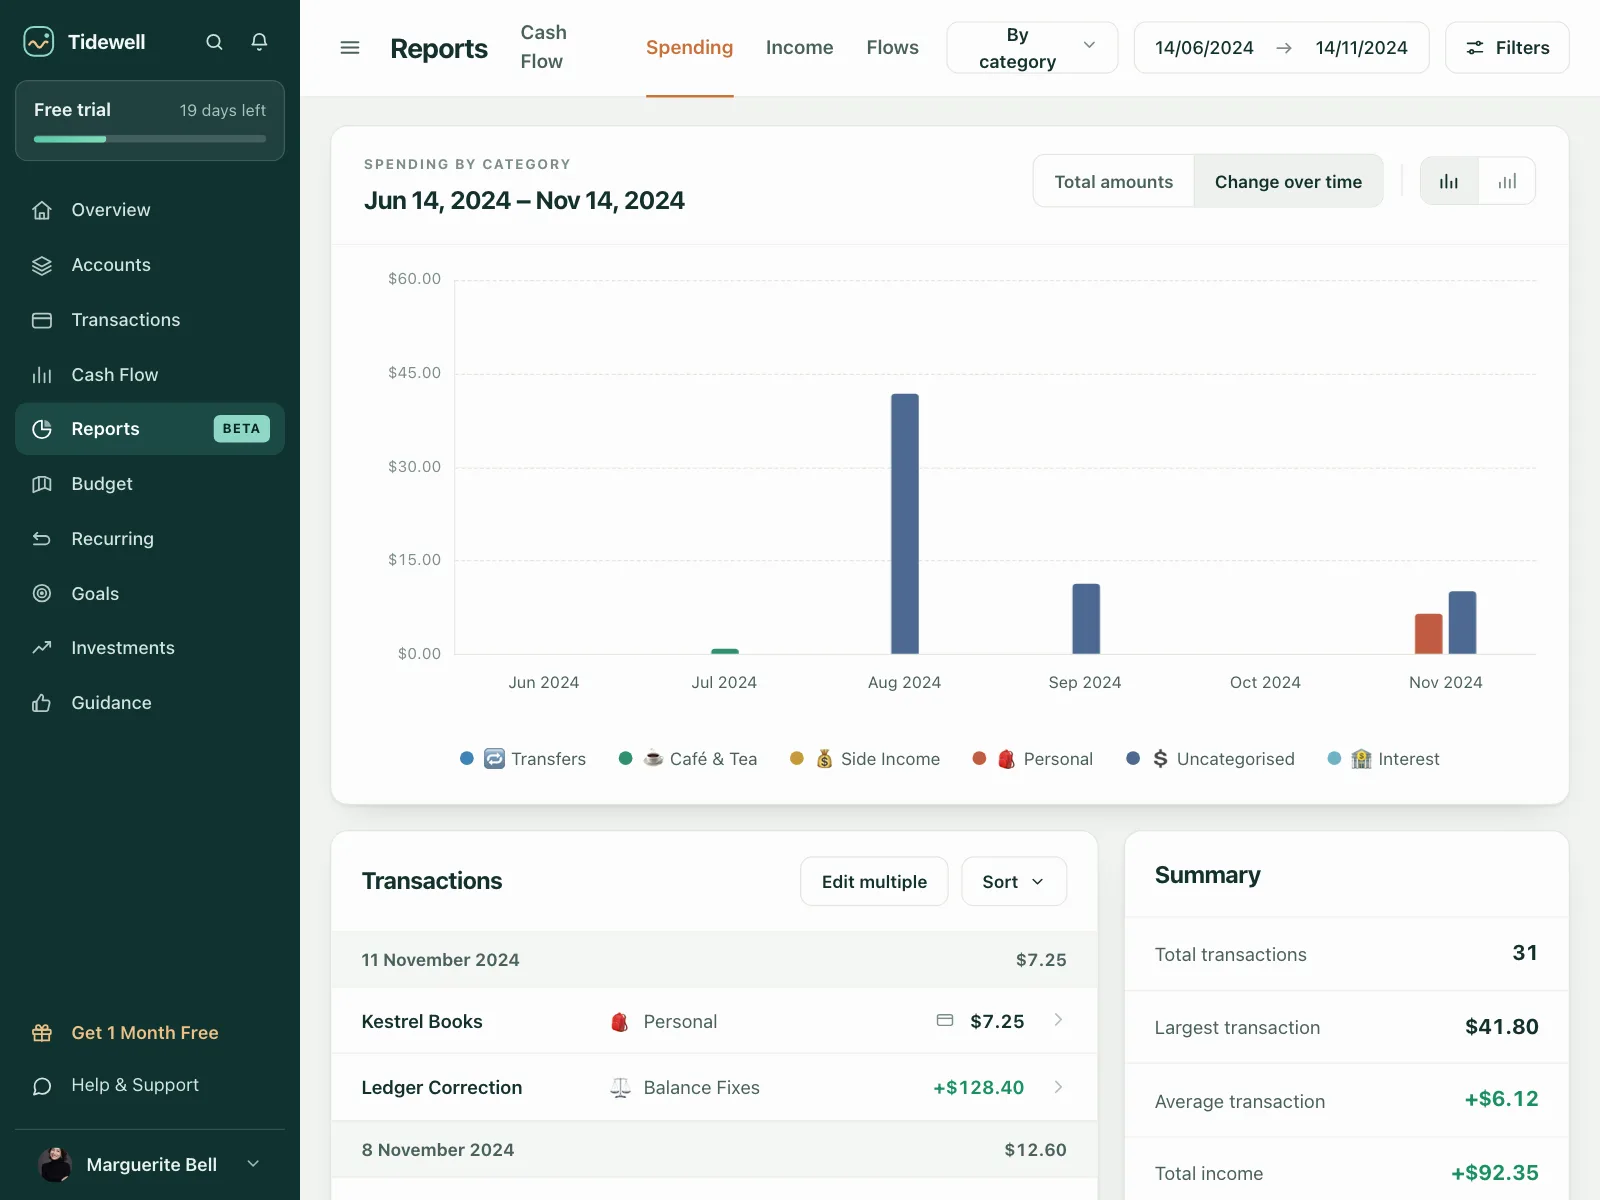
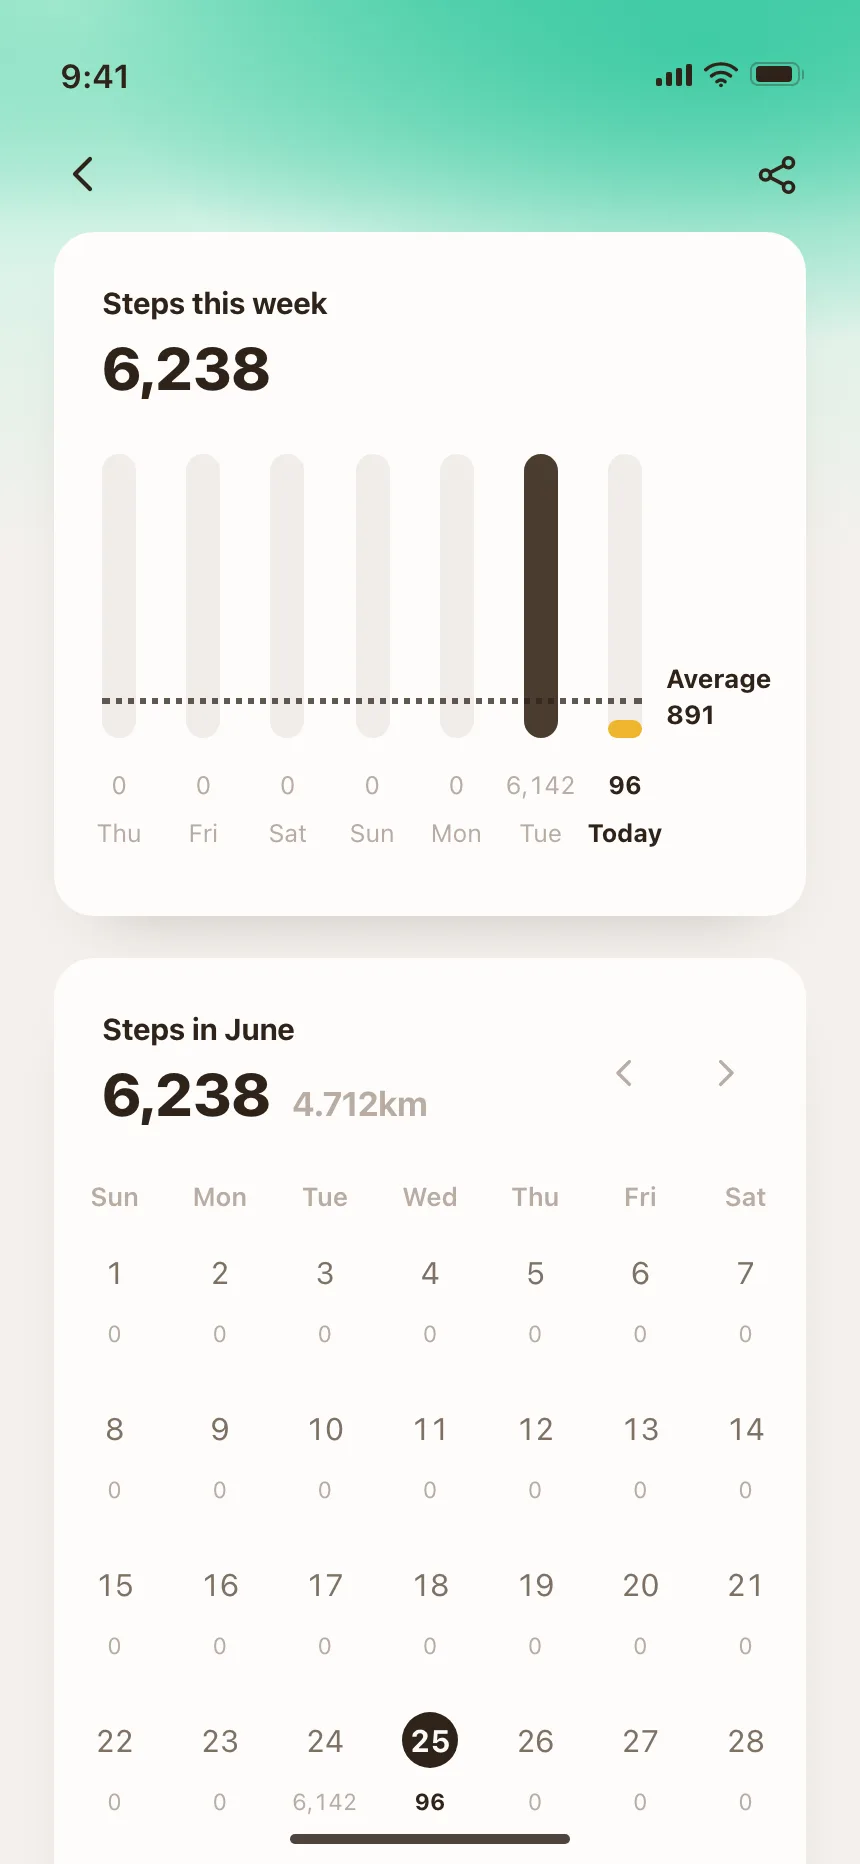
Bars compare amounts across days, months or categories. Stacked bars split each one into parts, and a dashed line marks the average.

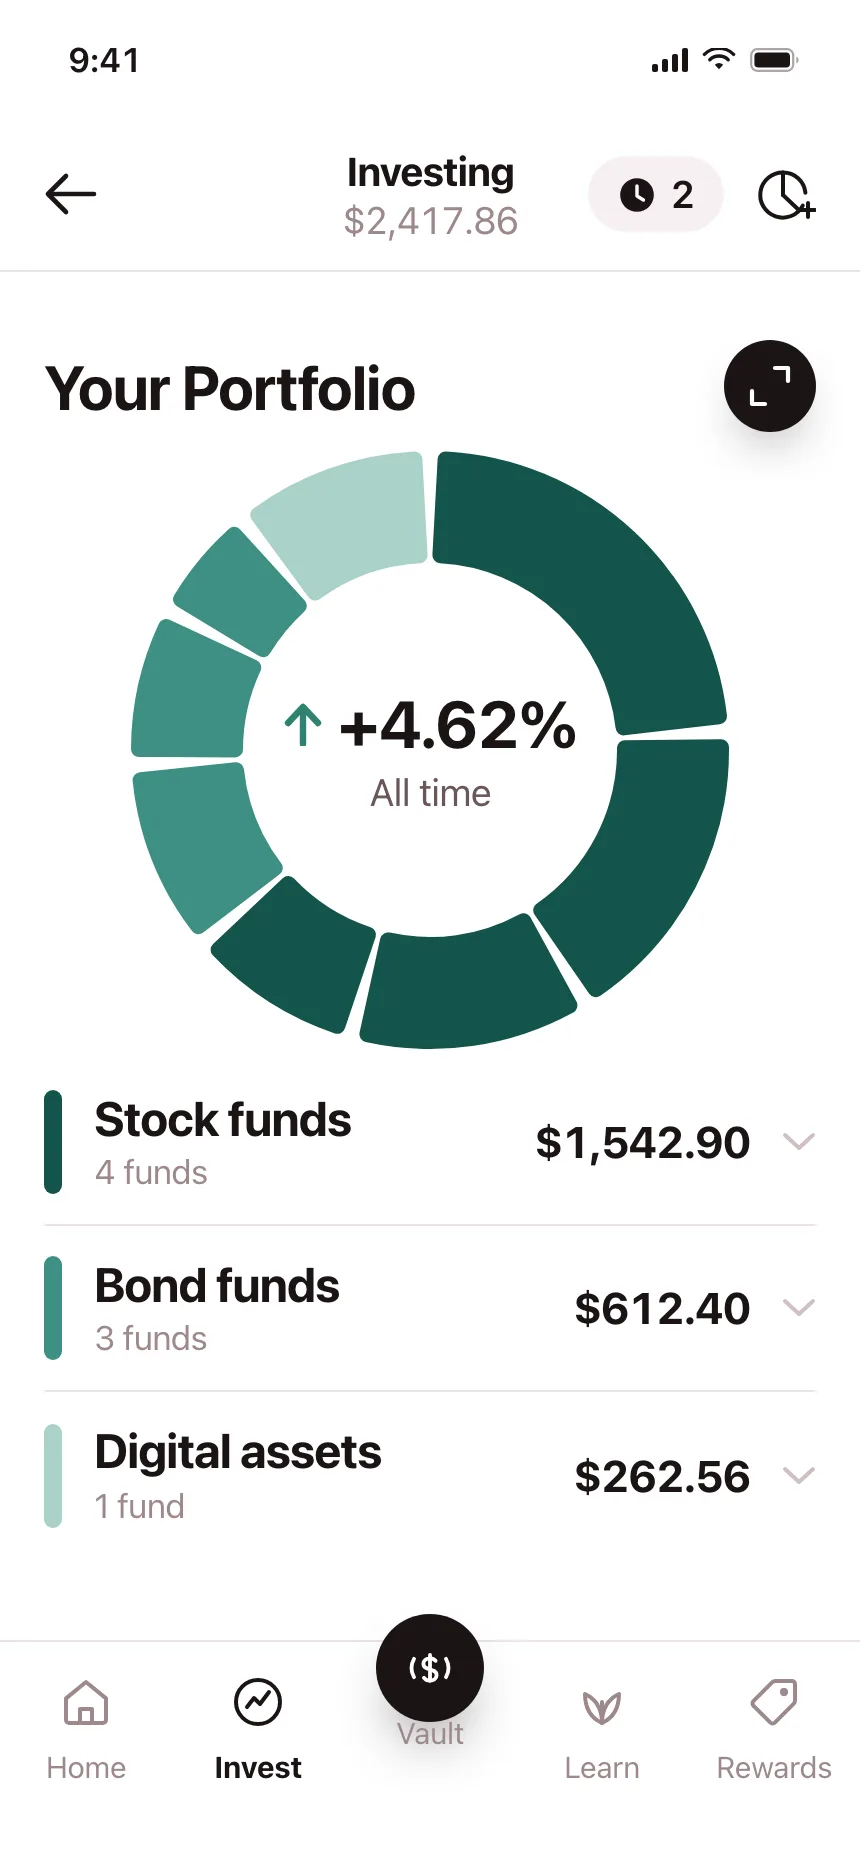
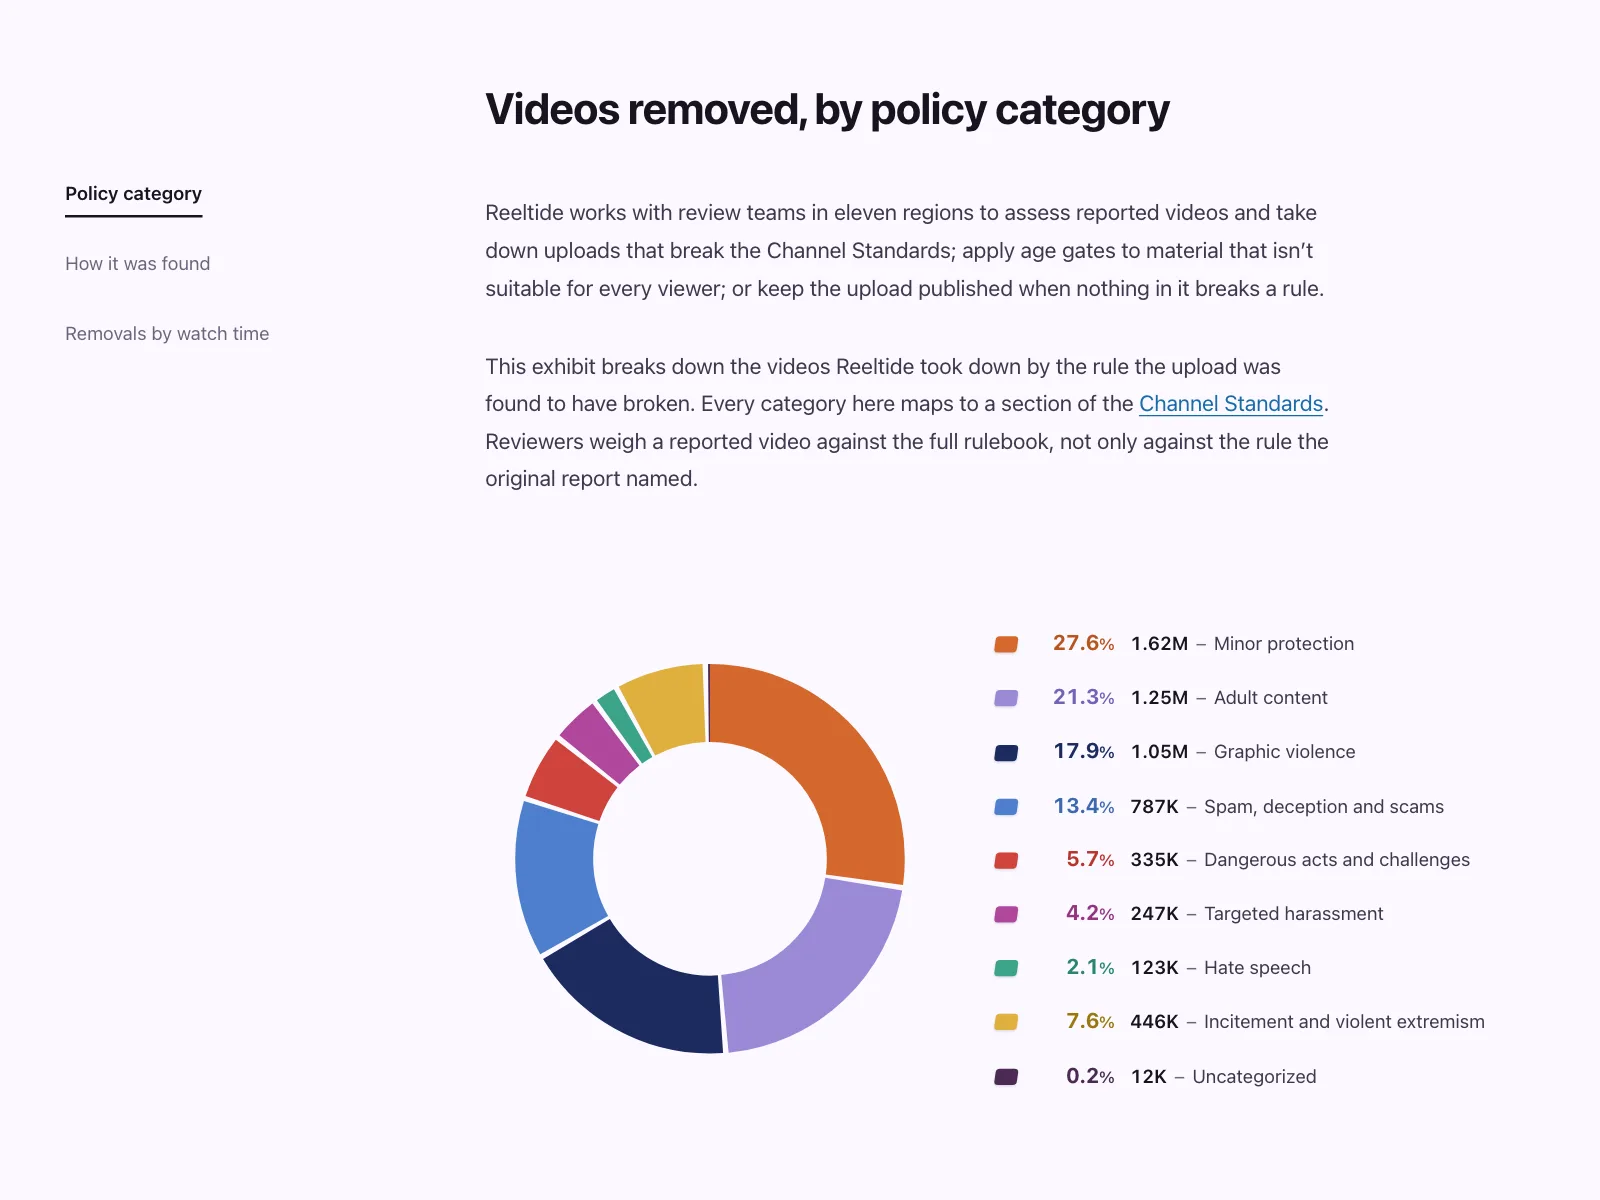
3. Donut and pie charts
Slices of one whole, like a portfolio split or spend by category, often with a key figure in the middle of the donut.

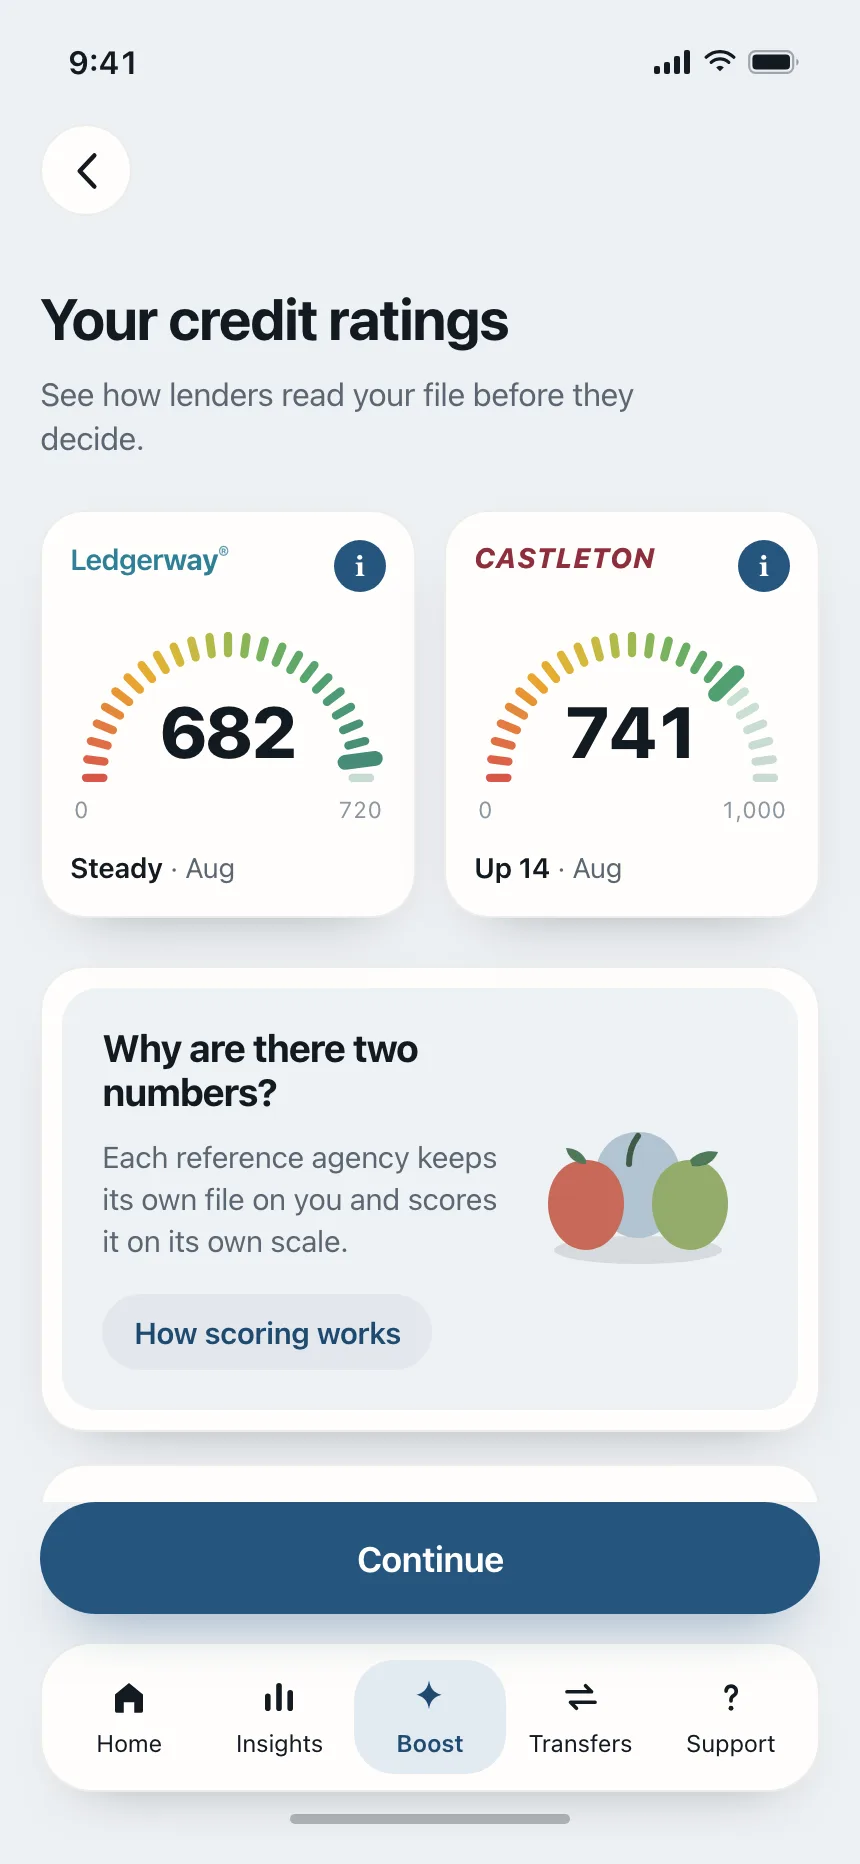
4. Rings and gauges
One value against a goal or a scale, like calories eaten today or a credit score from 300 to 850.


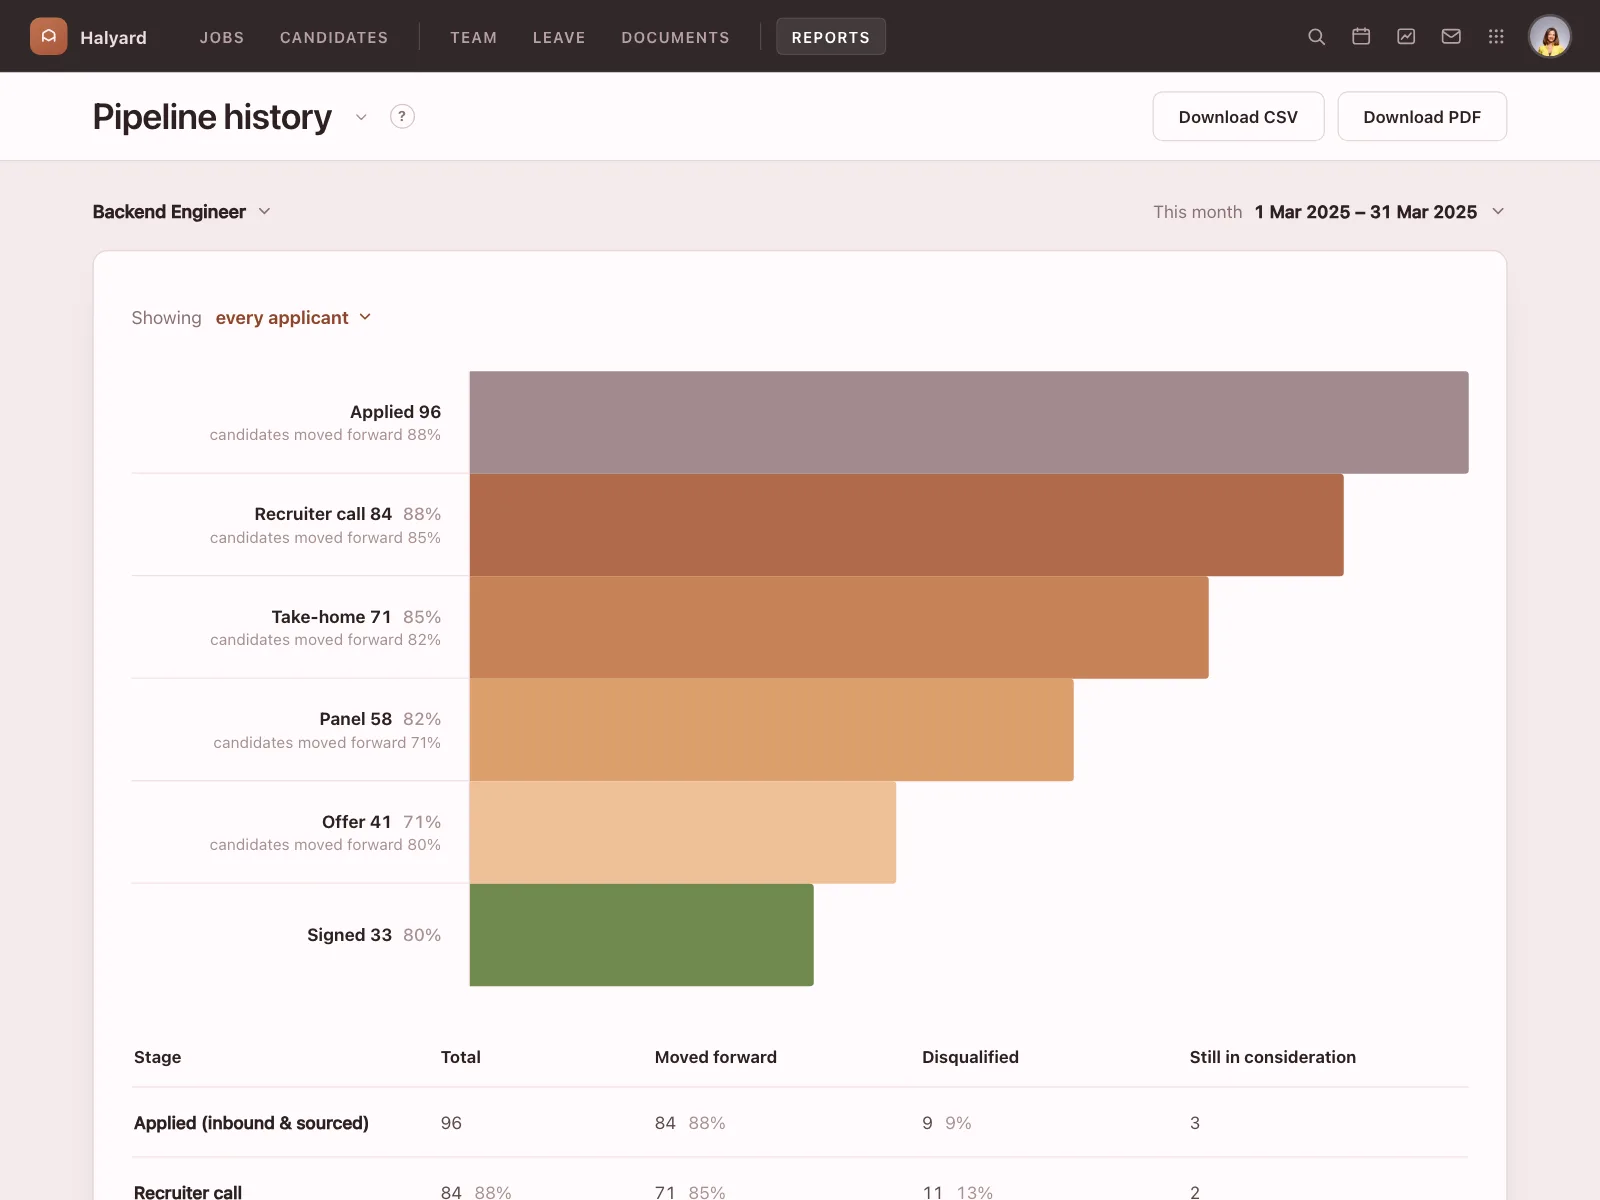
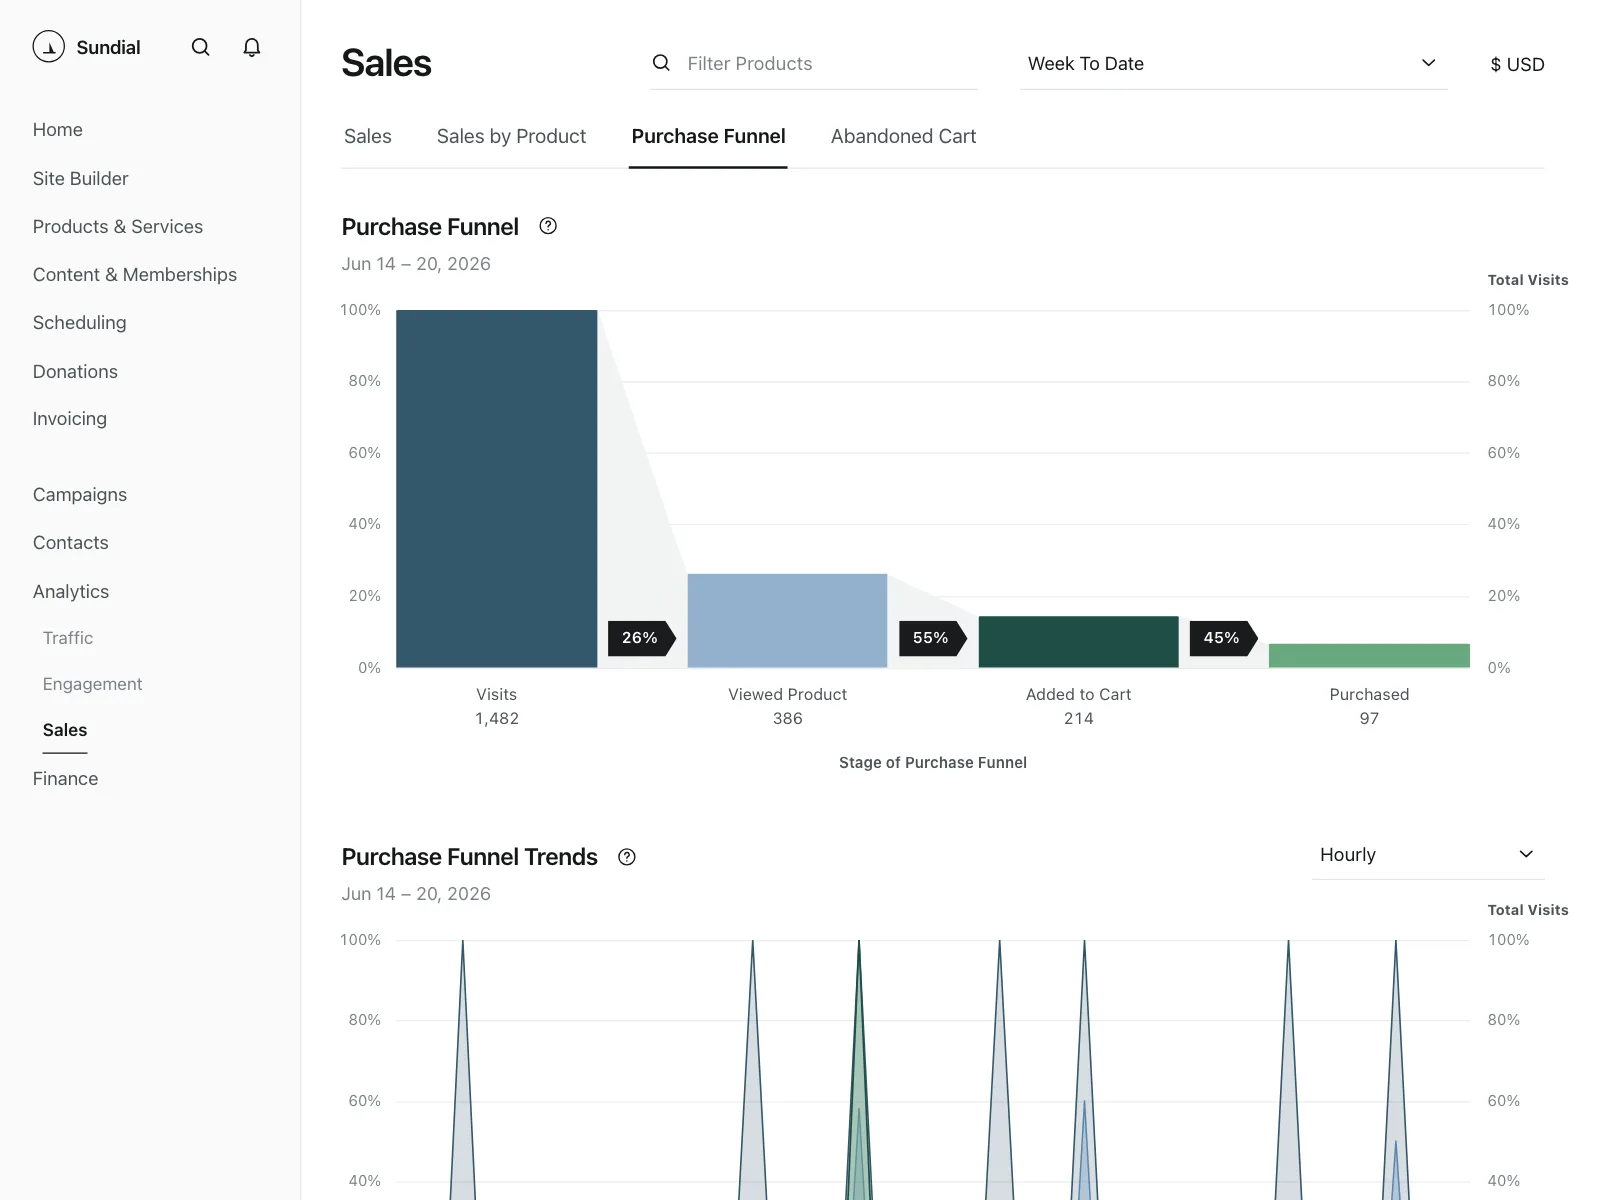
5. Funnels
Bars that shrink stage by stage, showing how many people make it from one step to the next and where they drop off.

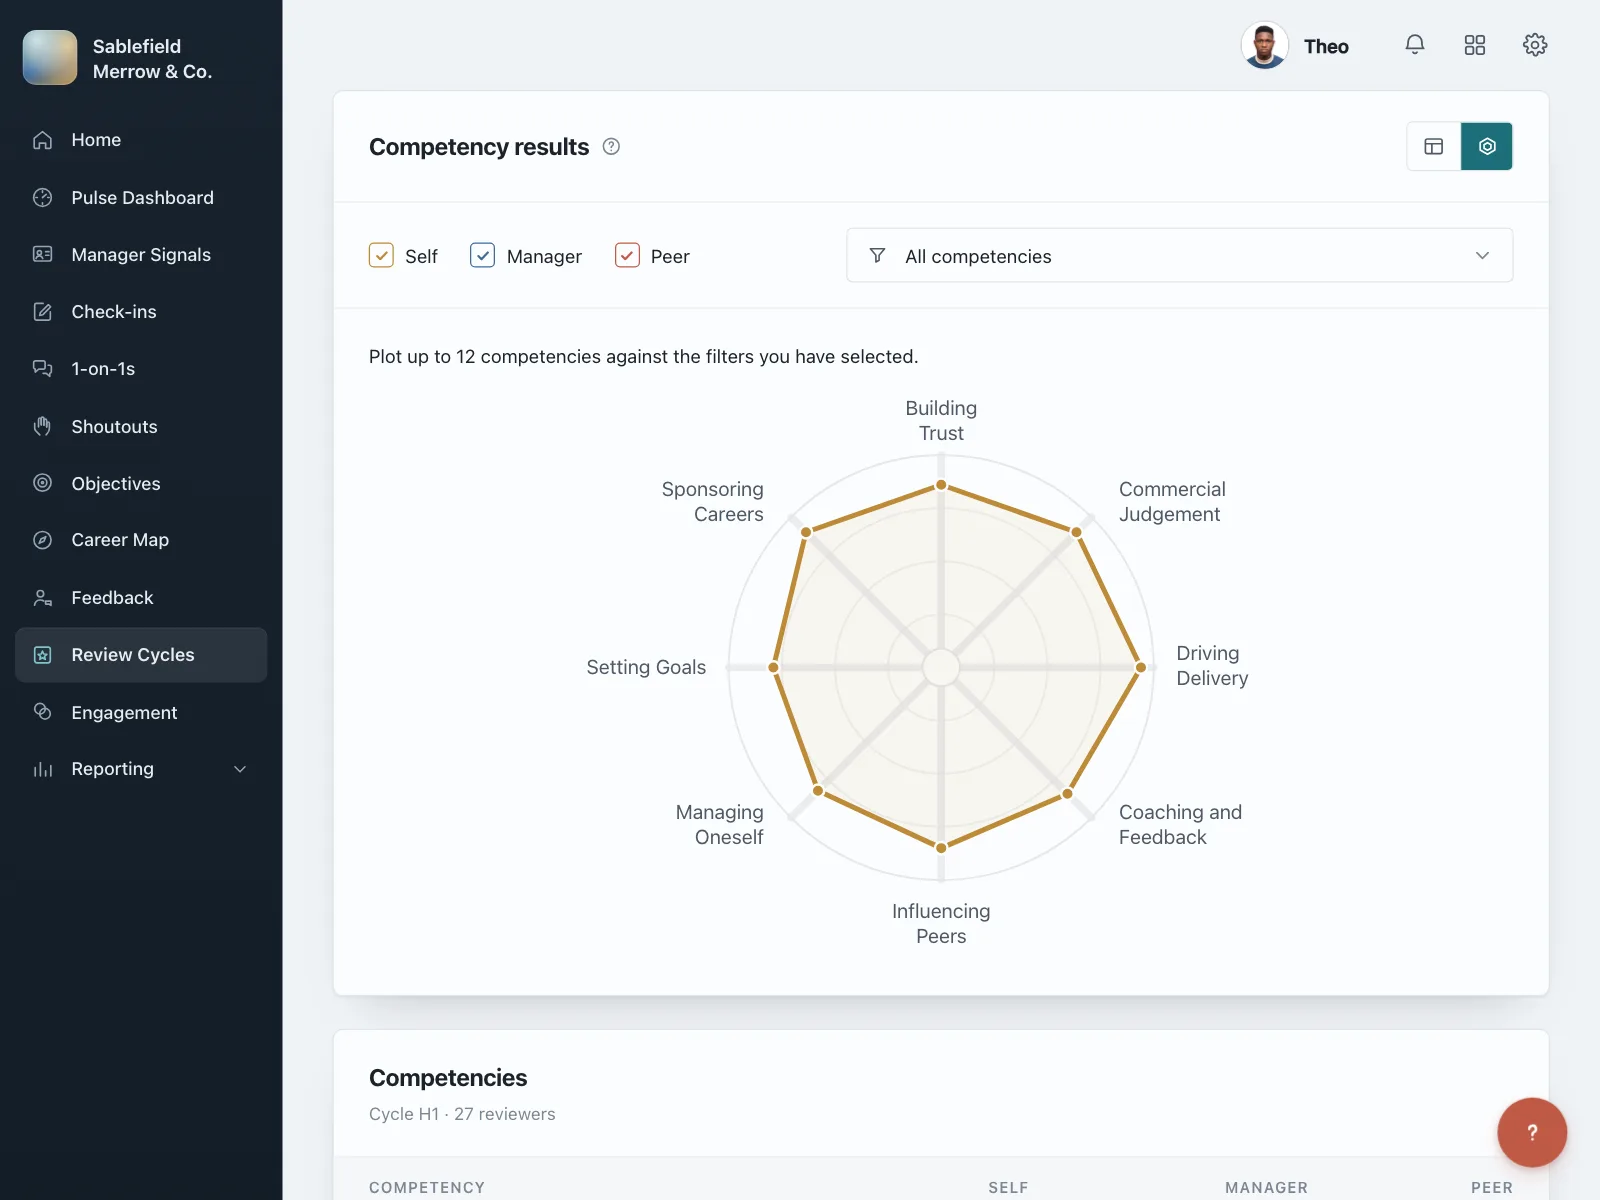
6. Candlesticks, radars and heatmaps
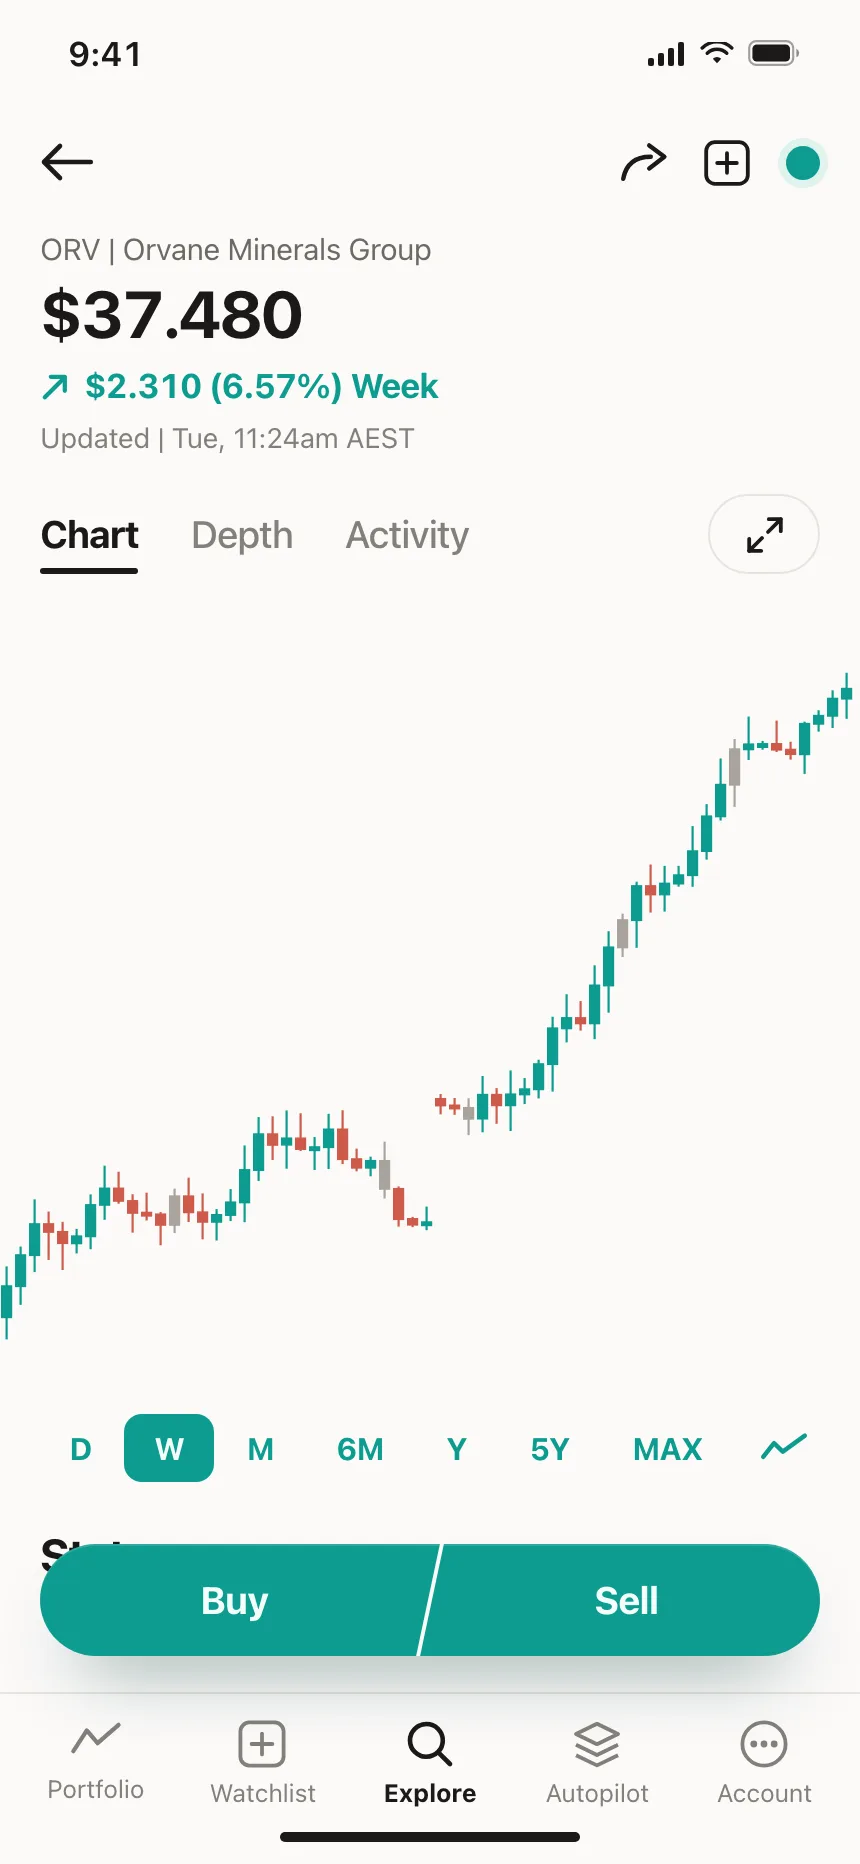
Specialist charts for one job each: price swings on a trading screen, scores across several skills, and the busiest hours of the week.


Where charts show up
Analytics dashboards
Traffic, usage and time-tracking reports lead with one wide chart, often under a row of totals.
Money and investing
Price history on a stock, spending by week or month, and where the money went by category.
Health and fitness
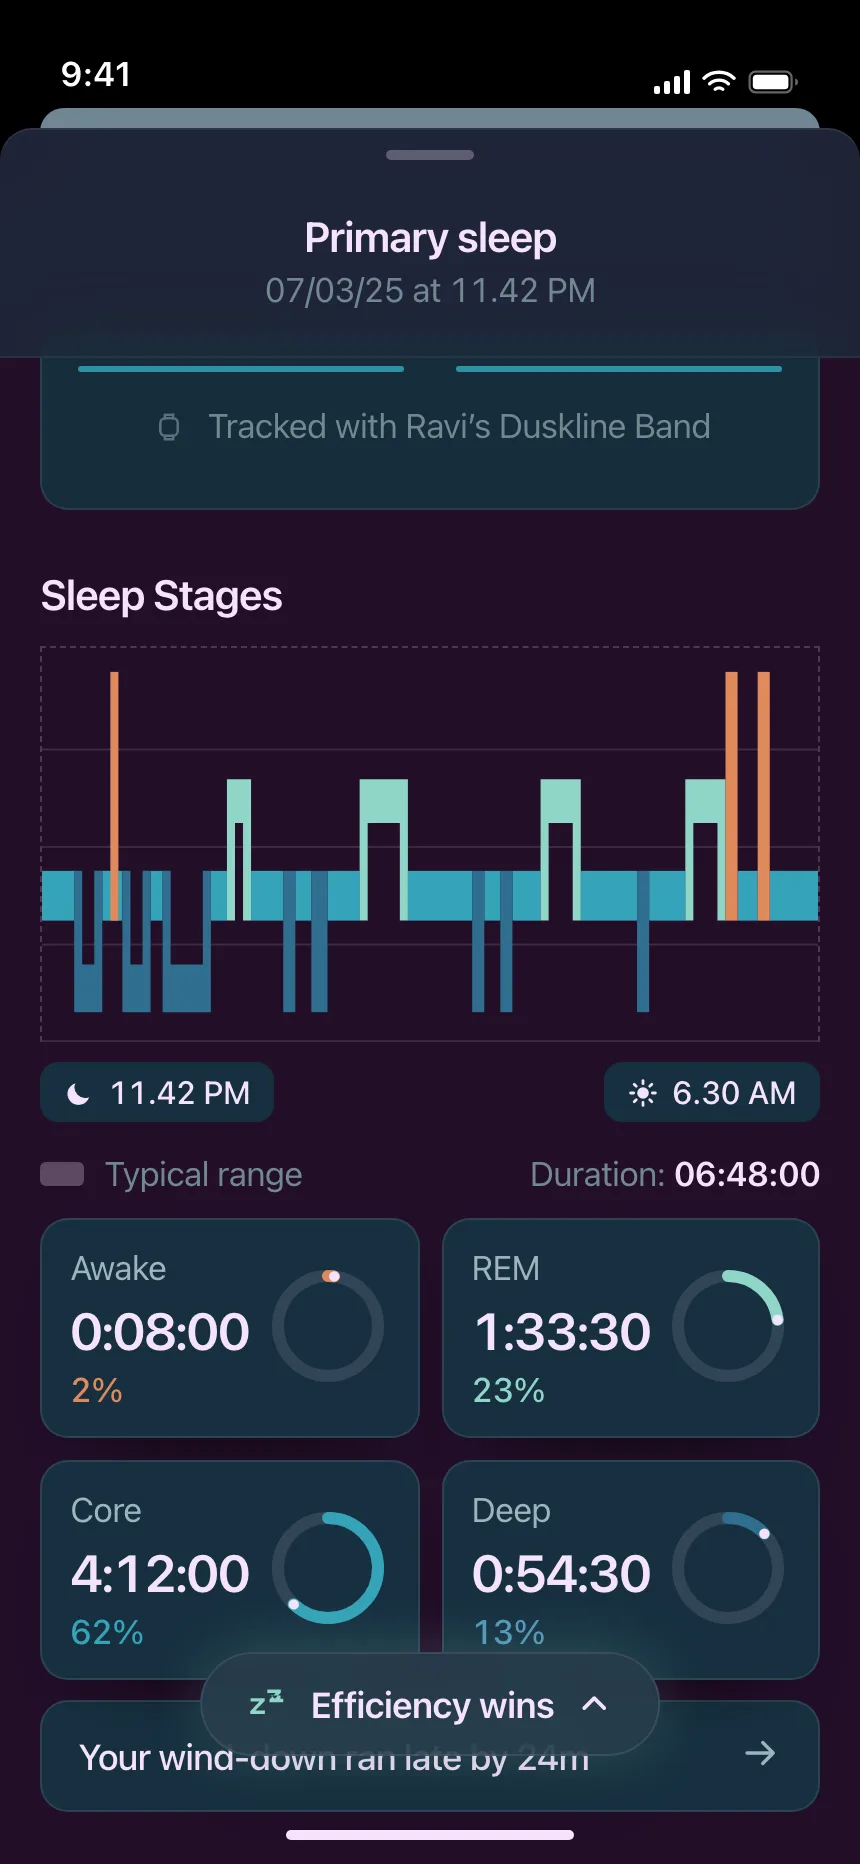
Sleep stages, daily steps and heart rate, often drawn against an average or a typical range.

Data stories
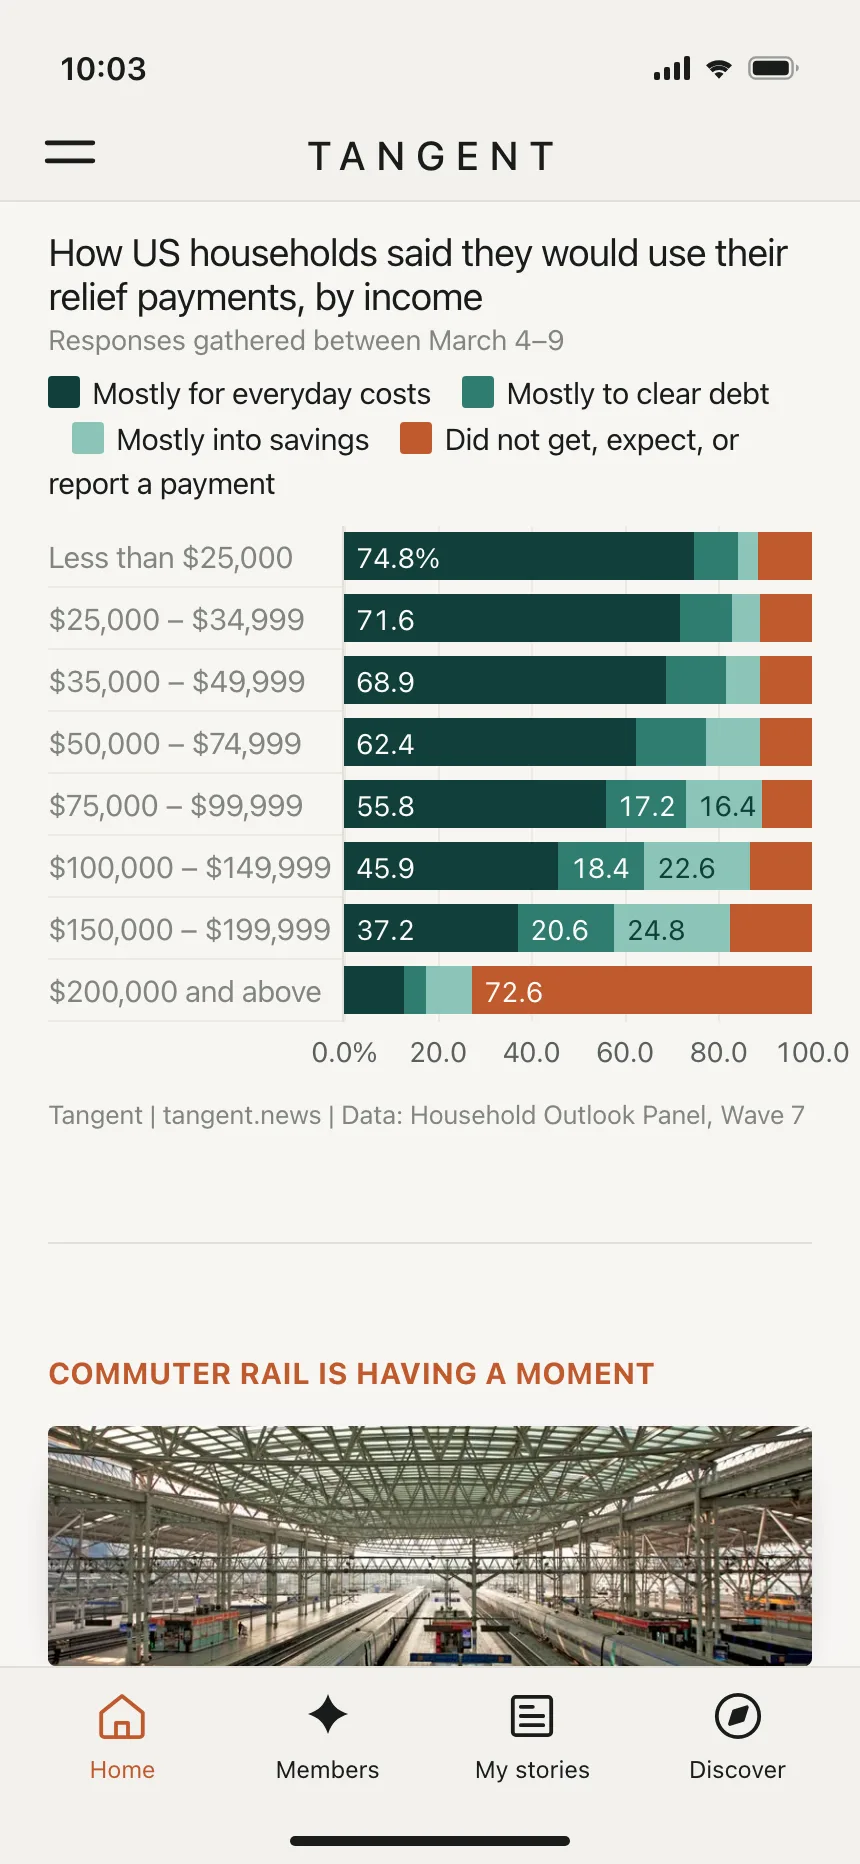
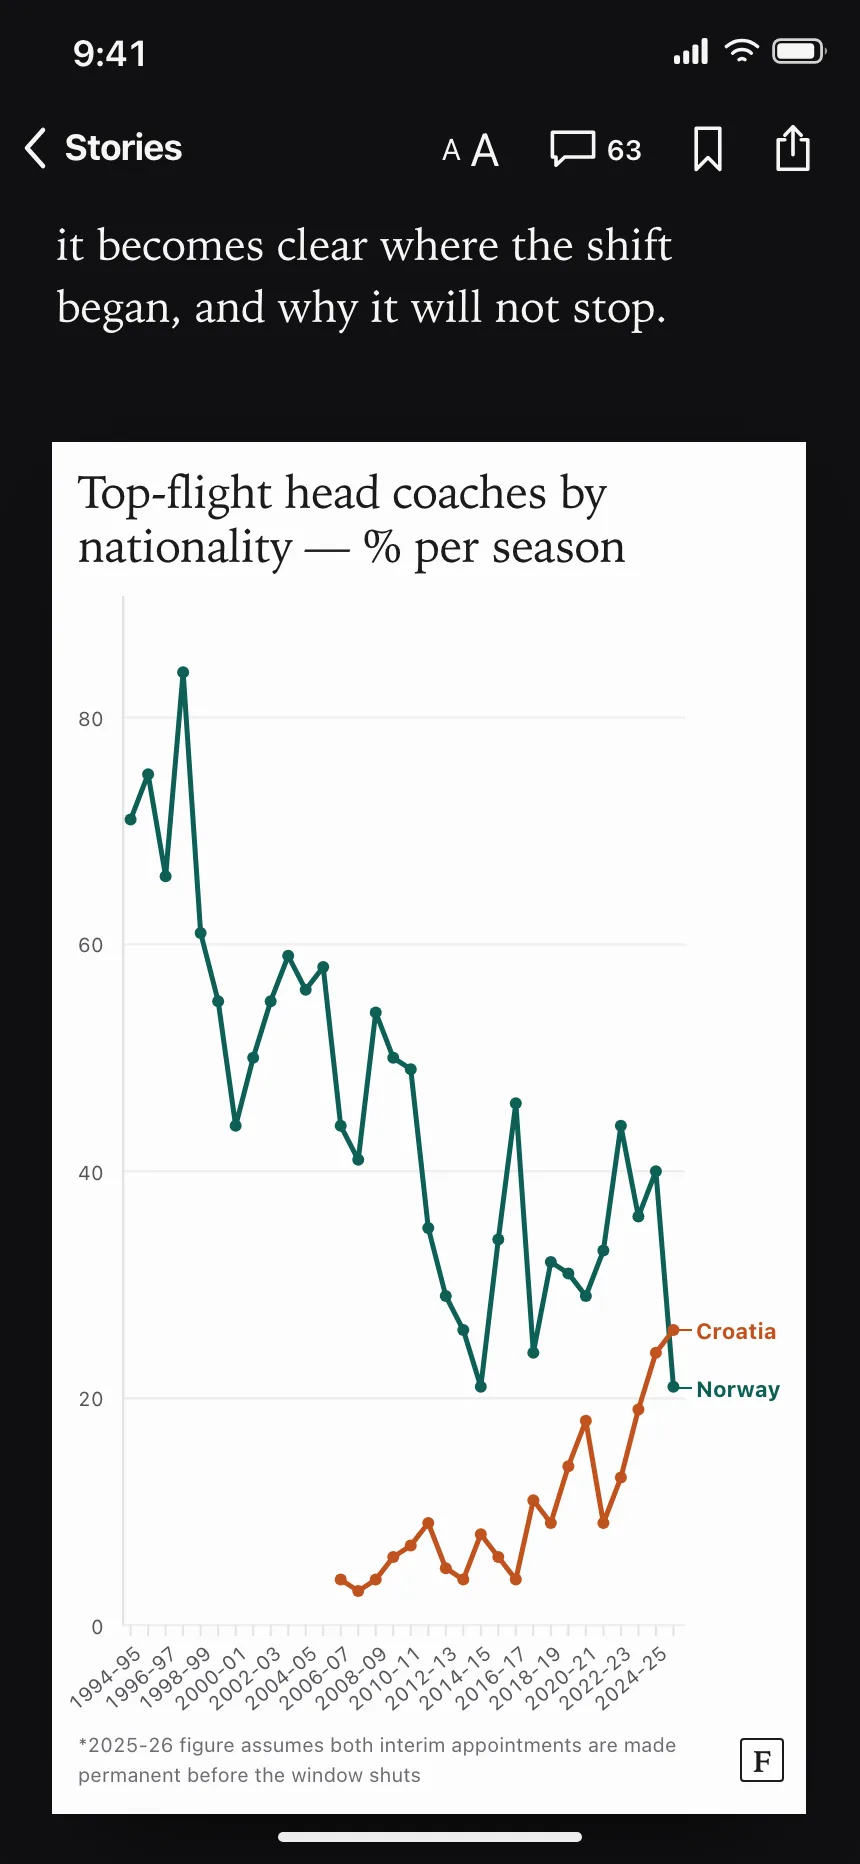
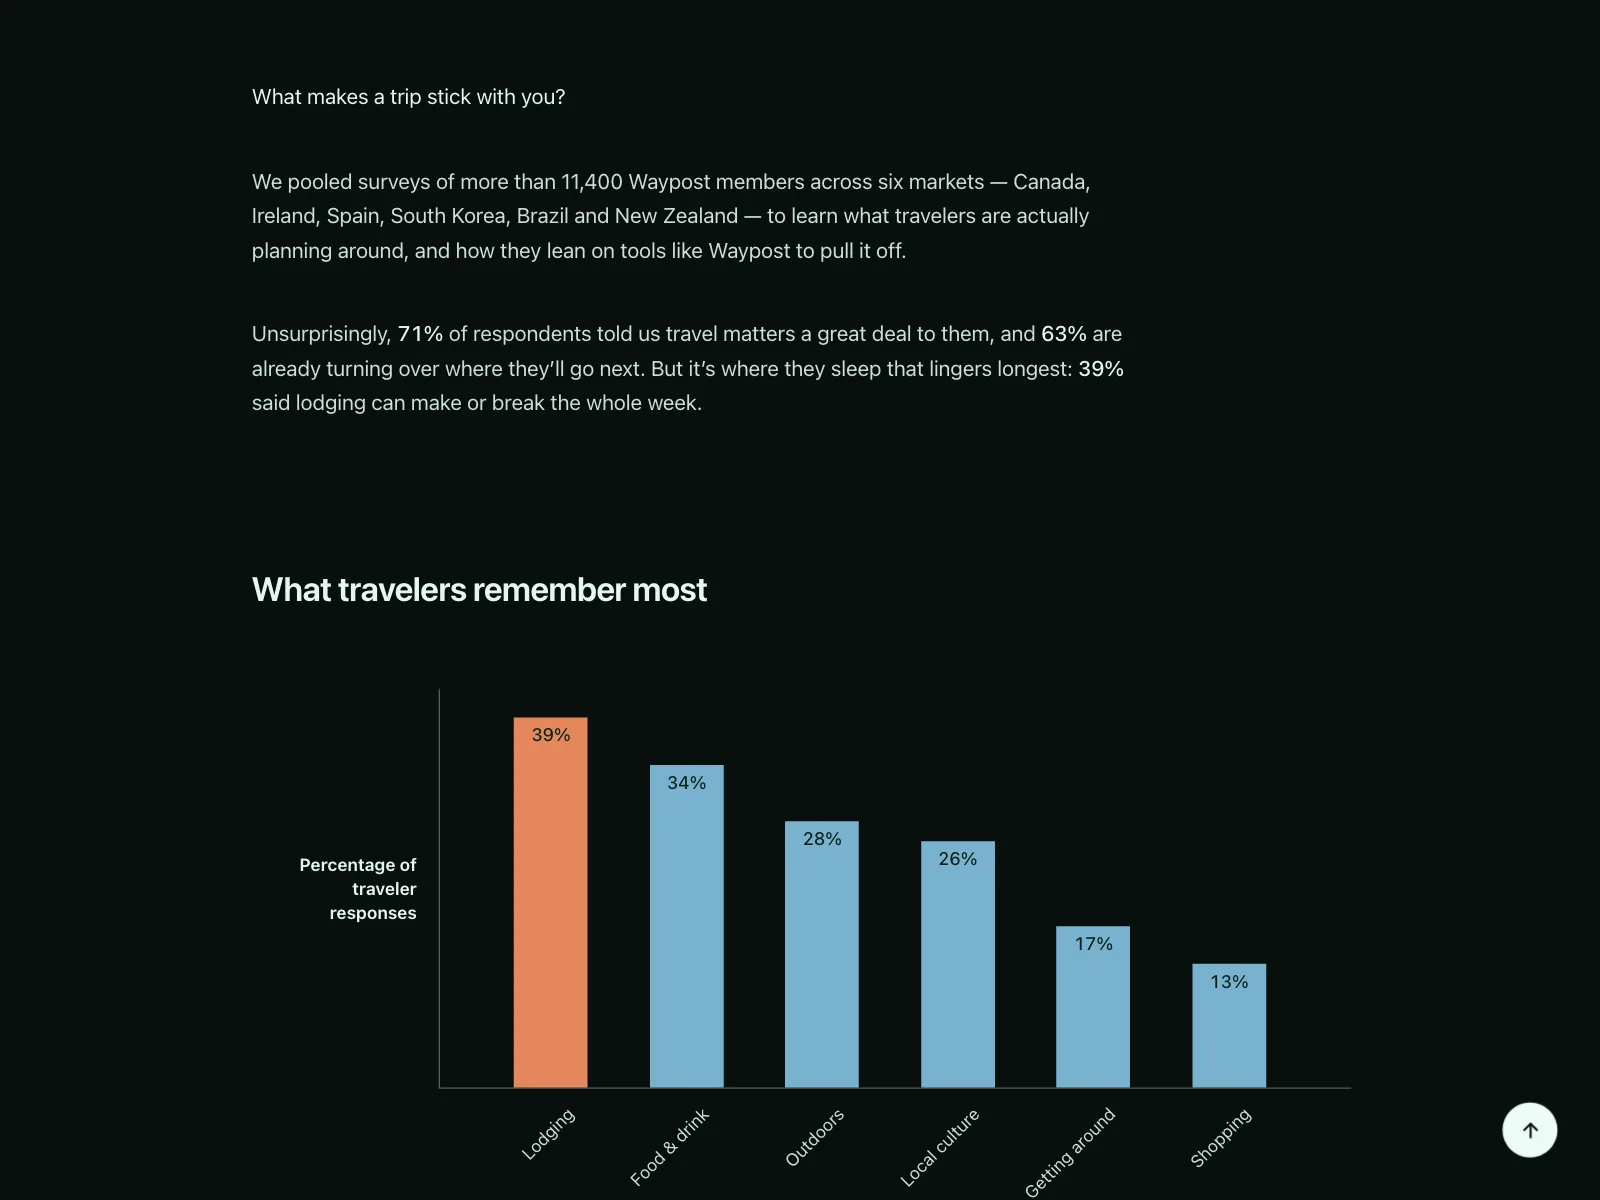
Charts set inside an article or a report, under a headline that says what the data shows.
Charts vs similar components

Build notes
- Give every chart a title that names the measure and the period, plus a one-line takeaway.
- Offer the same data as a table. A chart is a complex image and needs a text alternative.
- Don't rely on color alone. Label series directly, or vary the line style and marker shape.
- Keep lines and bars at a 3:1 contrast ratio or more against the background.
- Show exact values on keyboard focus as well as on hover.
- Start bar charts at zero, and give a series the same color in every chart that shows it.
FAQ
Which chart type should I use?
A line for change over time, bars to compare amounts across categories, a donut or pie for parts of one whole, and a ring or gauge for one value against a goal. When in doubt, pick a bar or line chart, since most people already know how to read them.
When is a pie chart a bad idea?
When it has more than a few slices or the values sit close together. Slices of nearly the same size are hard to tell apart, so a sorted bar chart reads better.
How do you make a chart accessible?
Give it a title and a short summary of what it shows, and offer the data as a table. Don't use color as the only way to tell series apart, keep lines and bars at 3:1 contrast against the background, and make tooltips reachable by keyboard.
Should the y-axis start at zero?
For bar charts, yes. A bar's length stands for its value, so a cut axis makes small gaps look large. A line chart can start near its lowest value when the shape of the change matters more than its size.
Related terms
All glossary terms · Browse 250 web and 165 mobile charts designs