Back to Examples

Harborline

Dashboard

Use this app page to import its canvas into your workspace, then remix it into your own design — same layout, components & styling.

Visit site

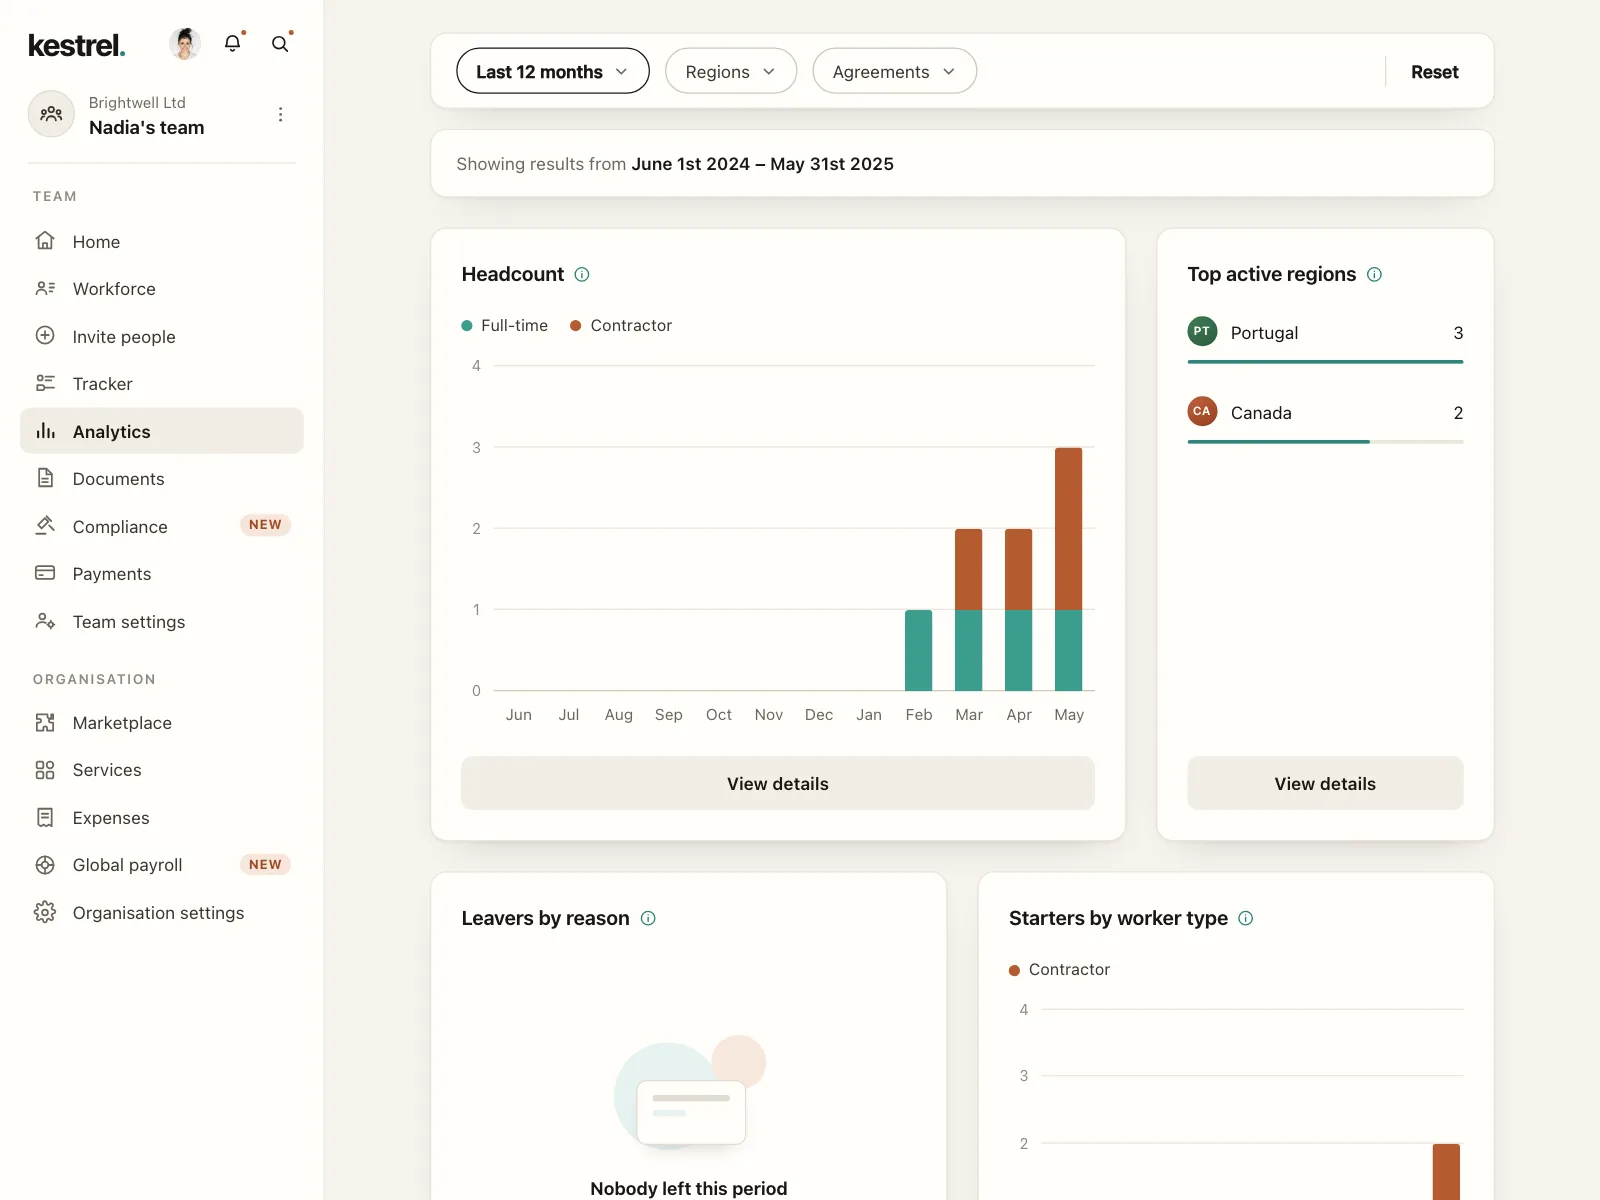
Peak hours analytics view in Harborline, a customer-support platform. Style: warm putty greys, teal accent, three-step green heat scale with an orange hatch key. Layout: icon rail, section nav, filter row, then one full-height heatmap card. Components: Date filter 'Nov 3, 2025 – Nov 6, 2025', Conversations opened metric, Table/Heatmap toggle, 24-hour rows by Monday–Saturday, Export data. Vibe: operational, quiet — support ops.
agent.kombai.com/kombai-inspiration-library/app-pages/dashboards/web/315/index.html
Harborline — Dashboard App Page Example | Kombai