Kestrel

Charts section#59 of 250Web

About this design

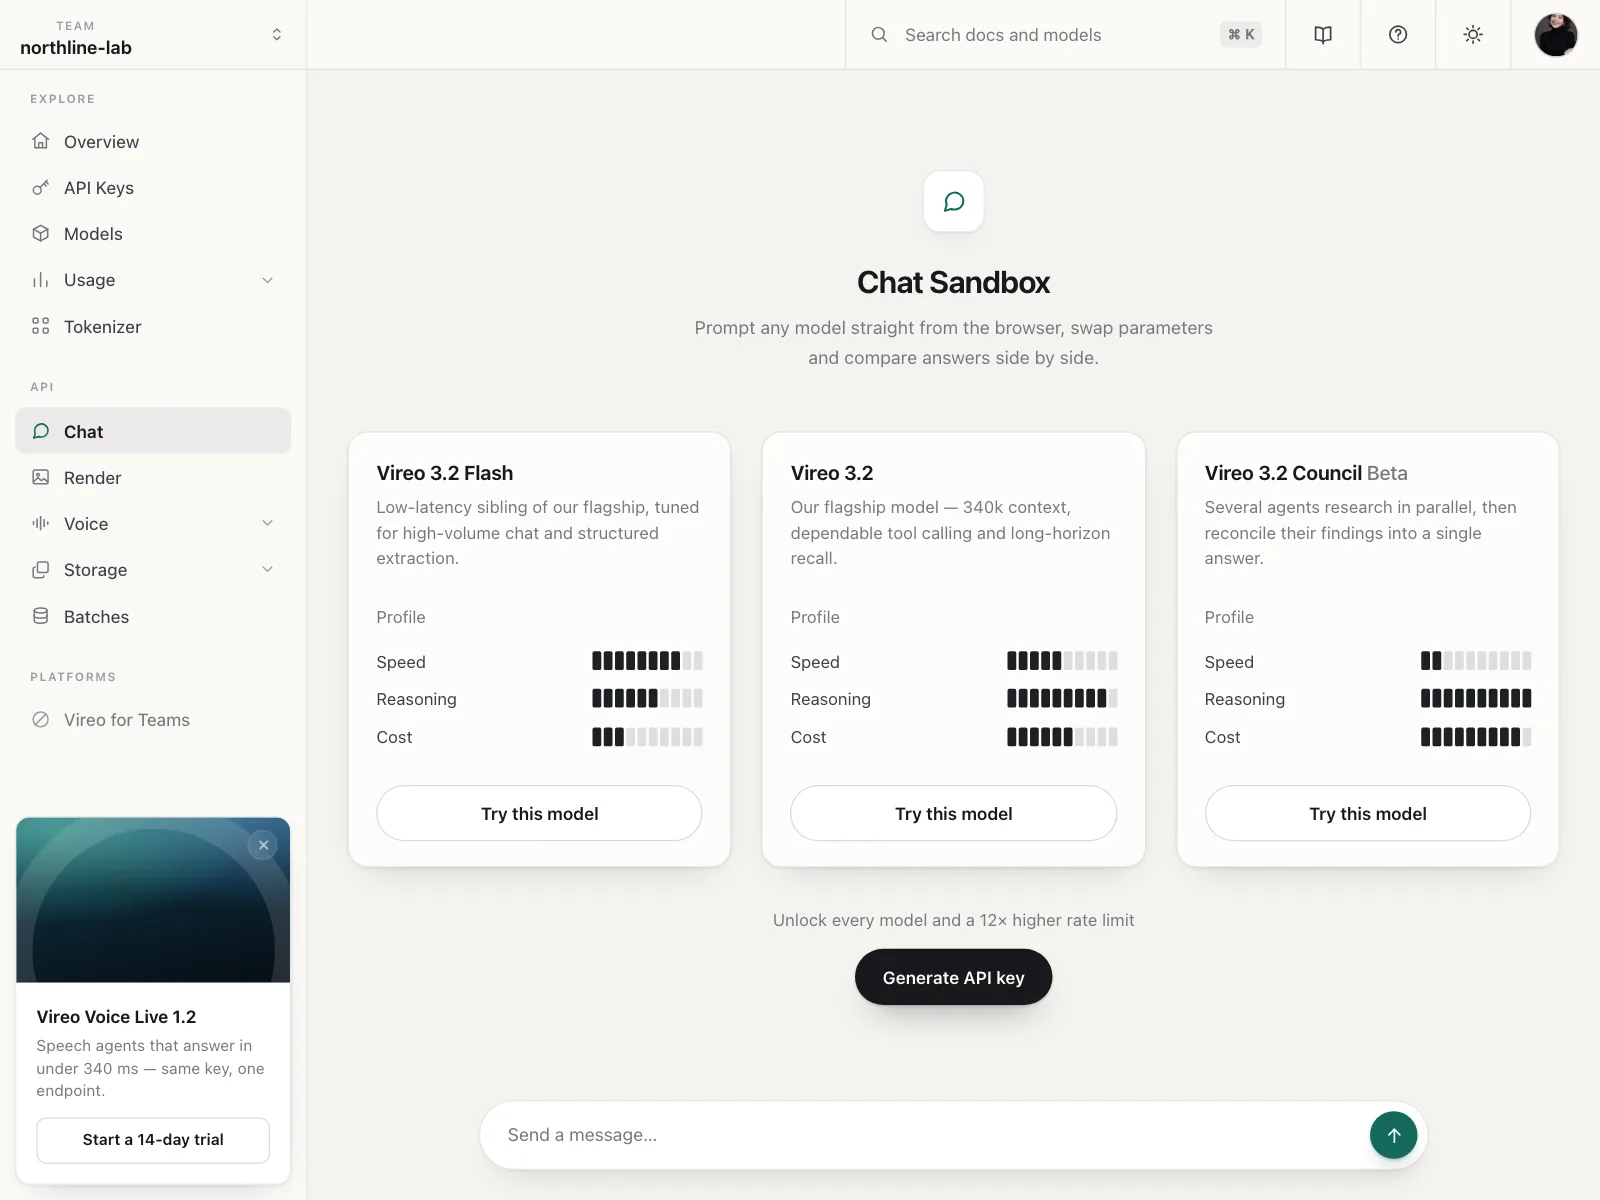
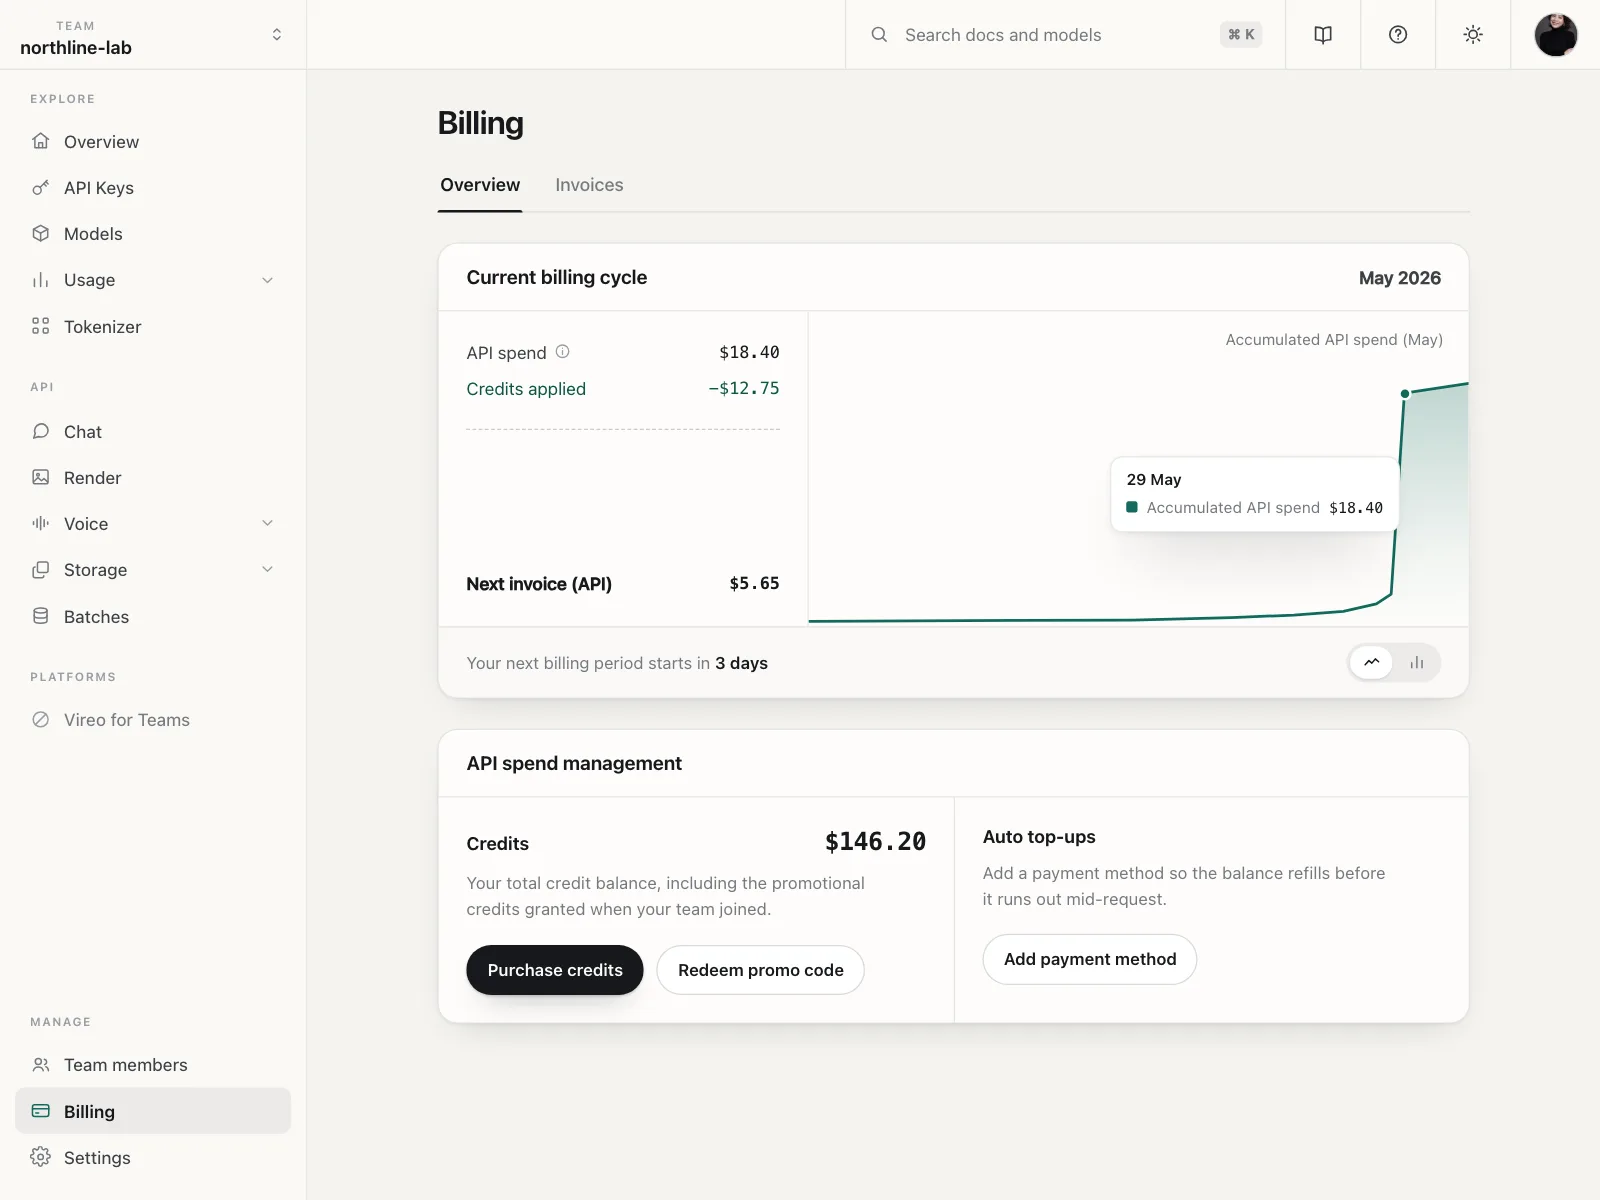
Charts section for Web: usage explorer for Northlight Labs on Kestrel, an API console, breaking down spend per key across two weeks.

  • Style: flat pale-mint canvas, teal accent, gradient bar chart, dense left nav.

  • Layout: left API nav beside a date-ranged bar chart above a breakdown table.
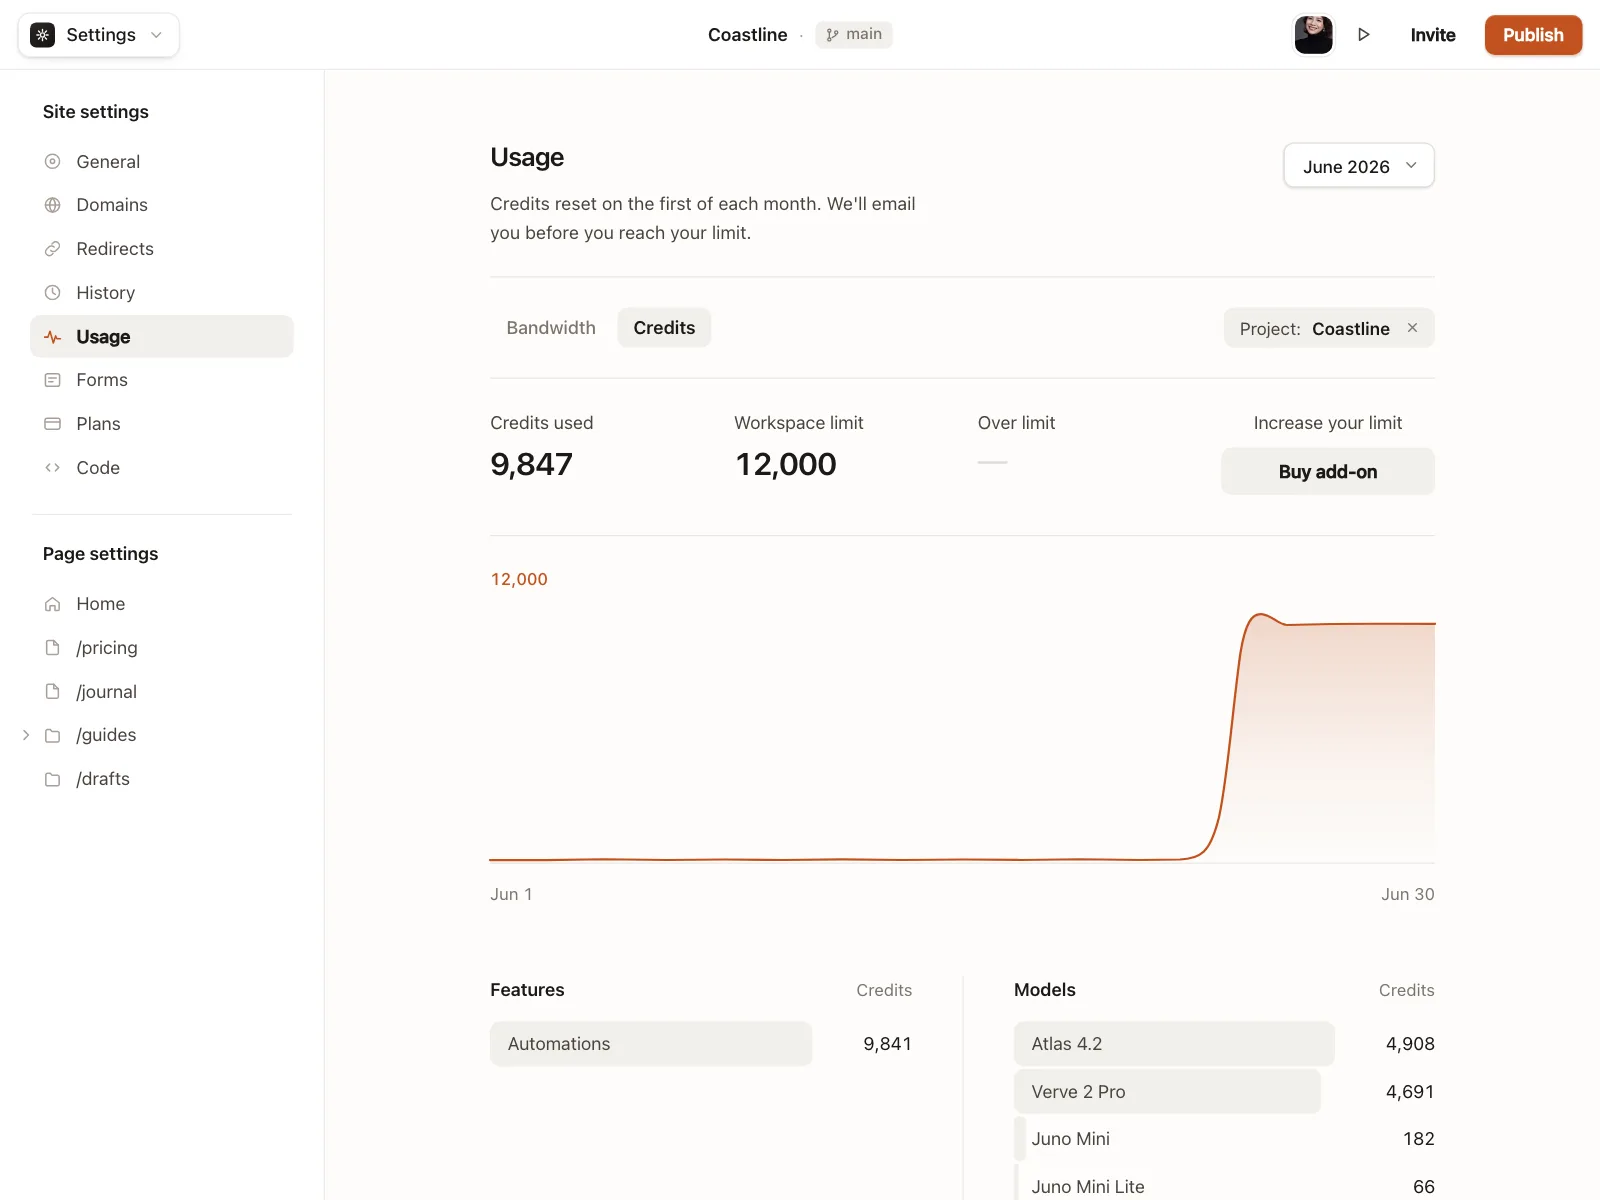
  • Components: Total/Average/Peak spend stats, daily spend chart, Options and Filters controls, per-day breakdown table.

  • Vibe: granular, cost-conscious — API usage analytics.

More Charts sections

View all 250
Charts
Charts | Sundial
Charts
Charts | Vireo
Charts
Charts | Vireo
Charts
Charts | Larkfield