Back to Examples

Fieldnote

Charts

Use this section to import its canvas into your workspace, then remix it into your own design — same layout, components & styling.

Visit site

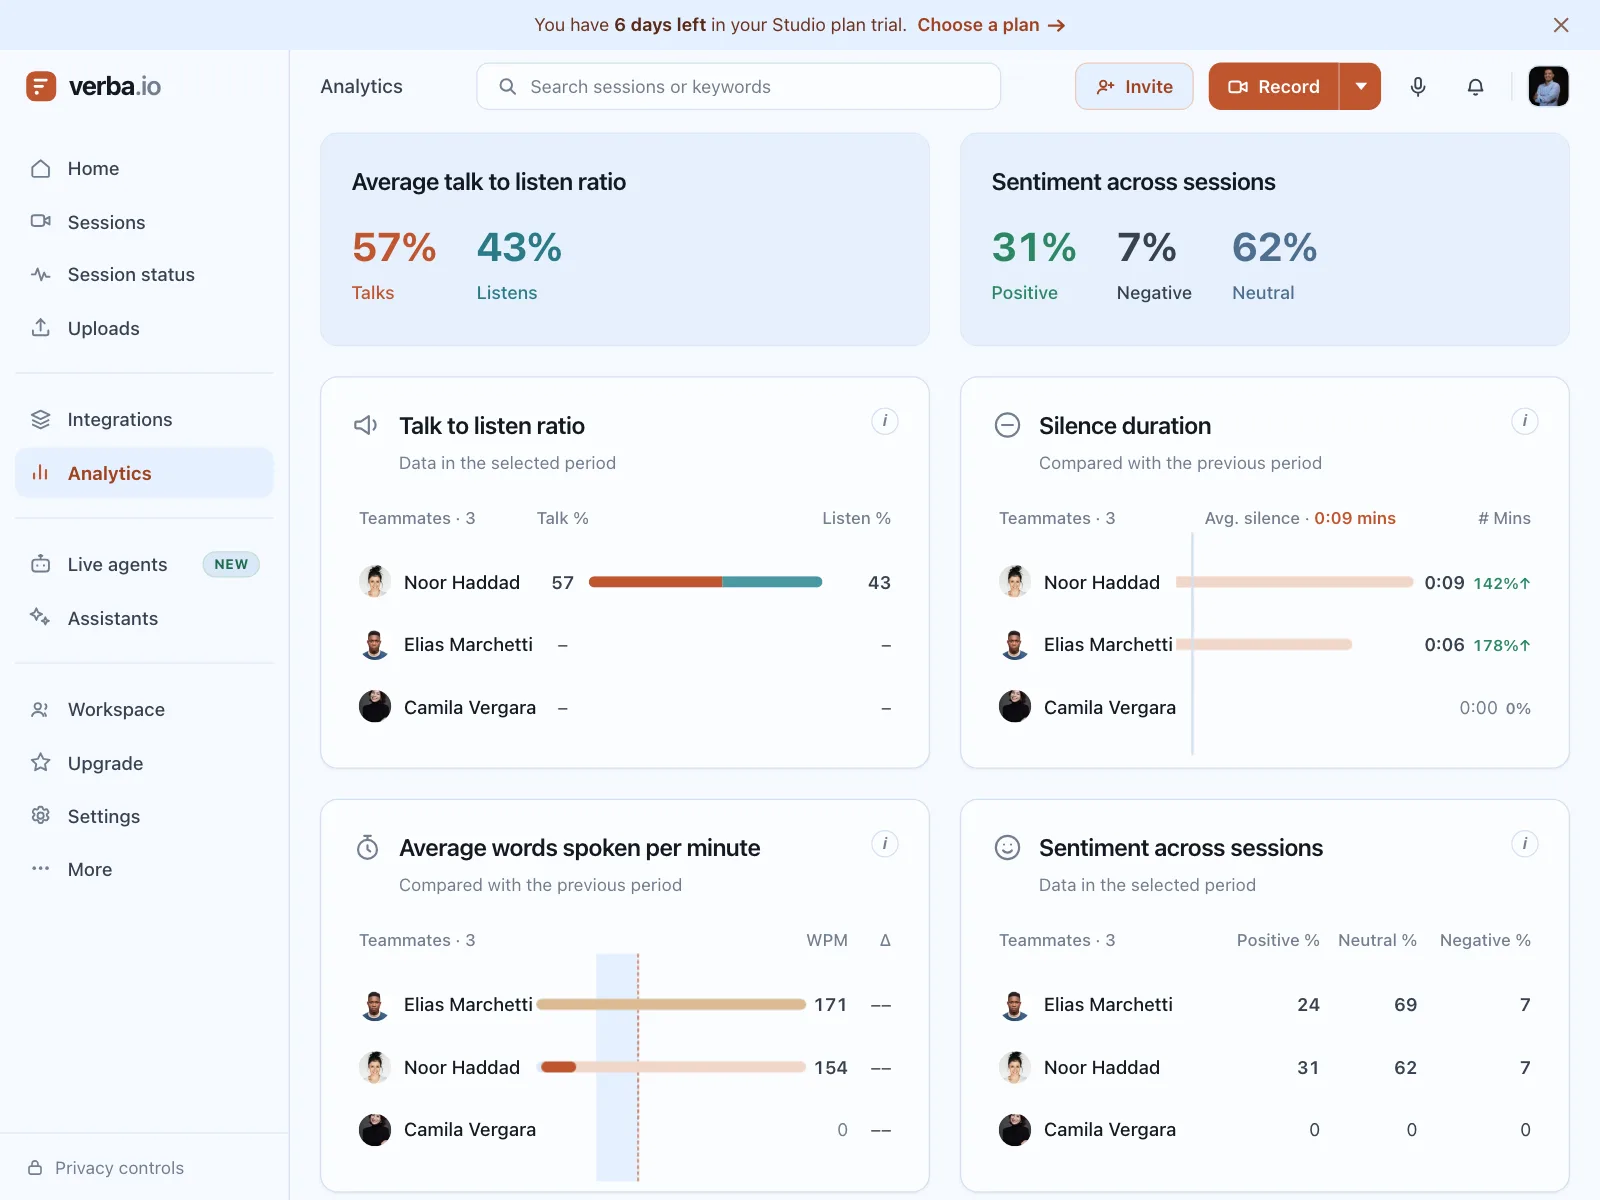
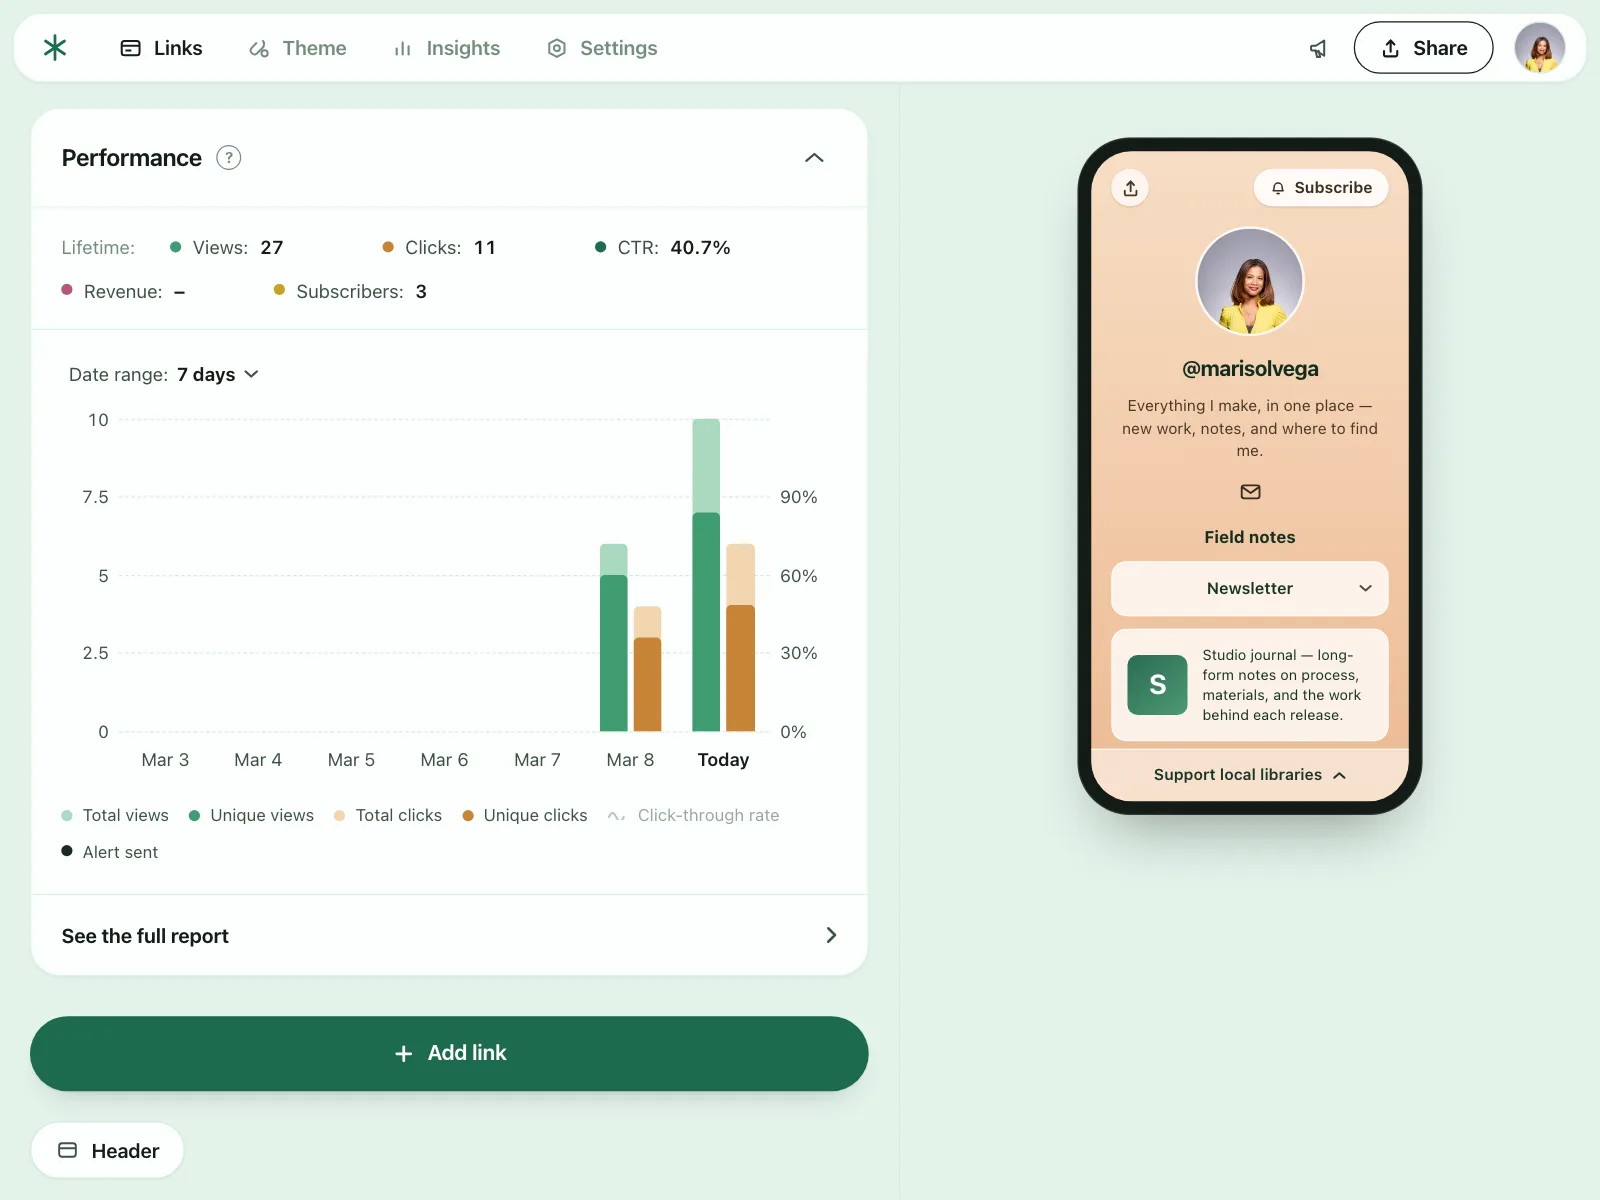
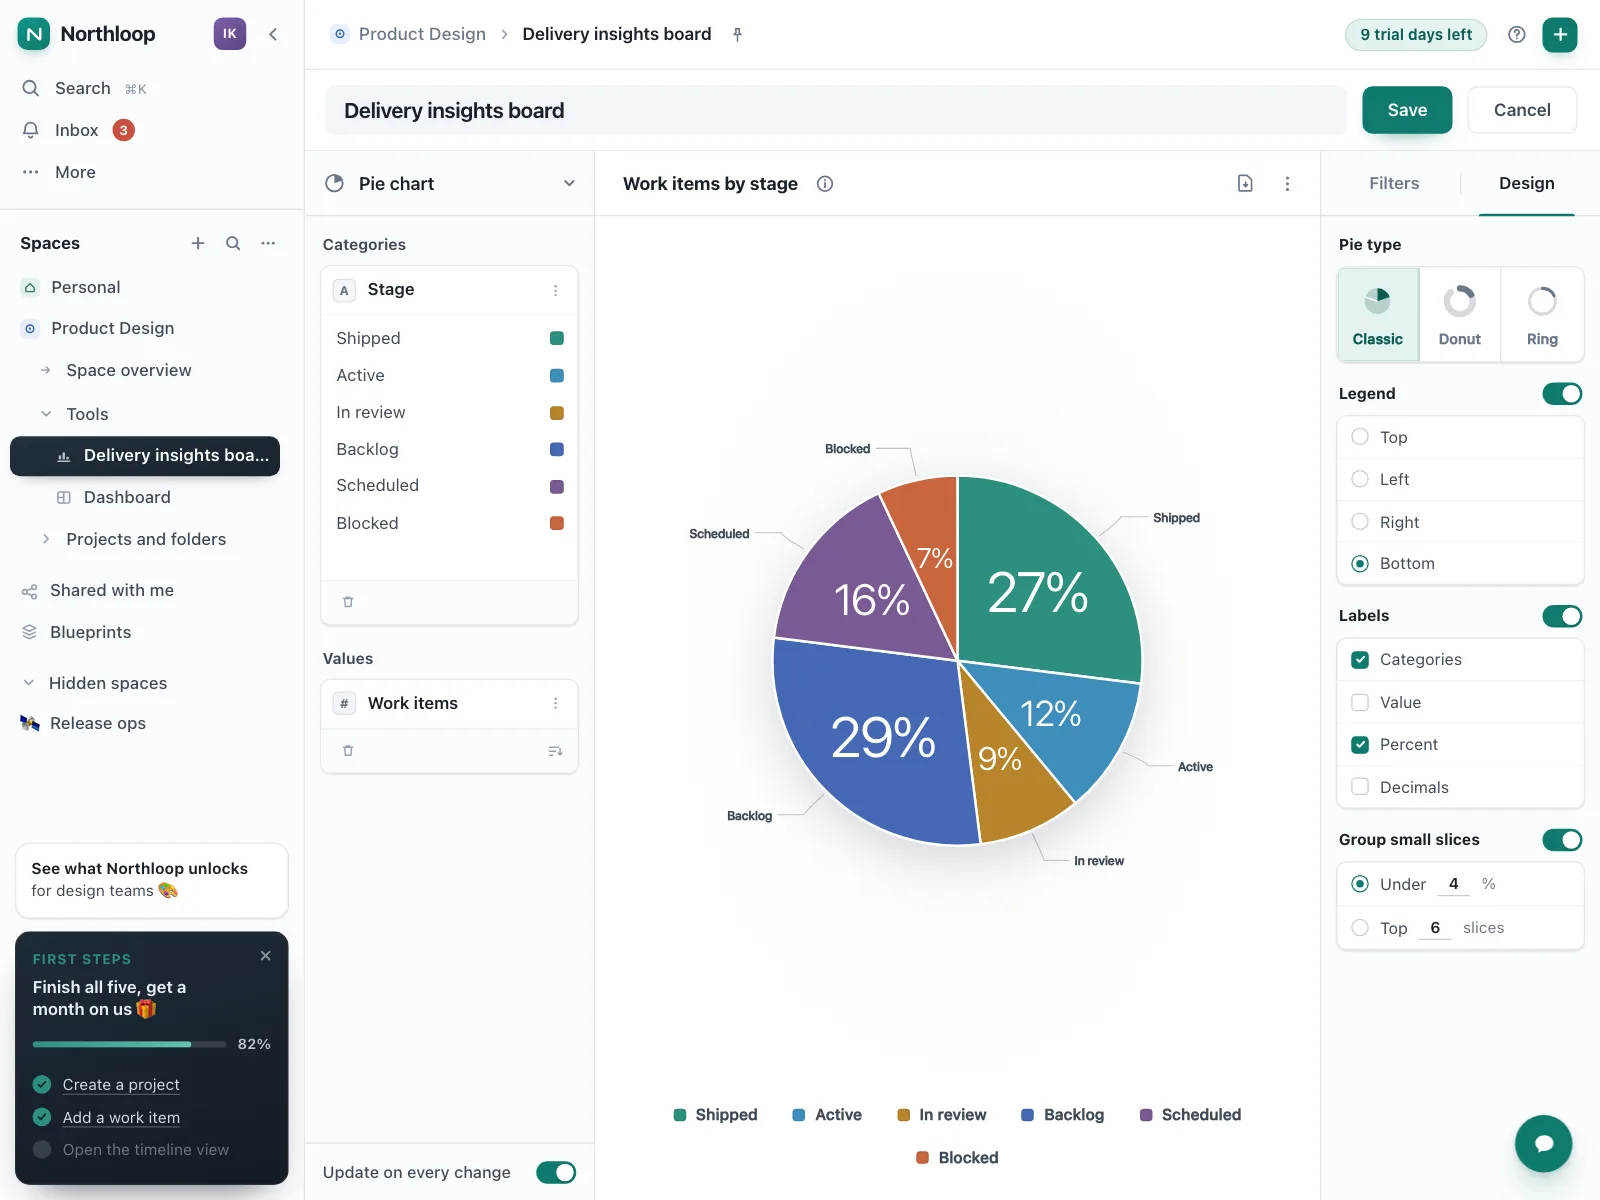
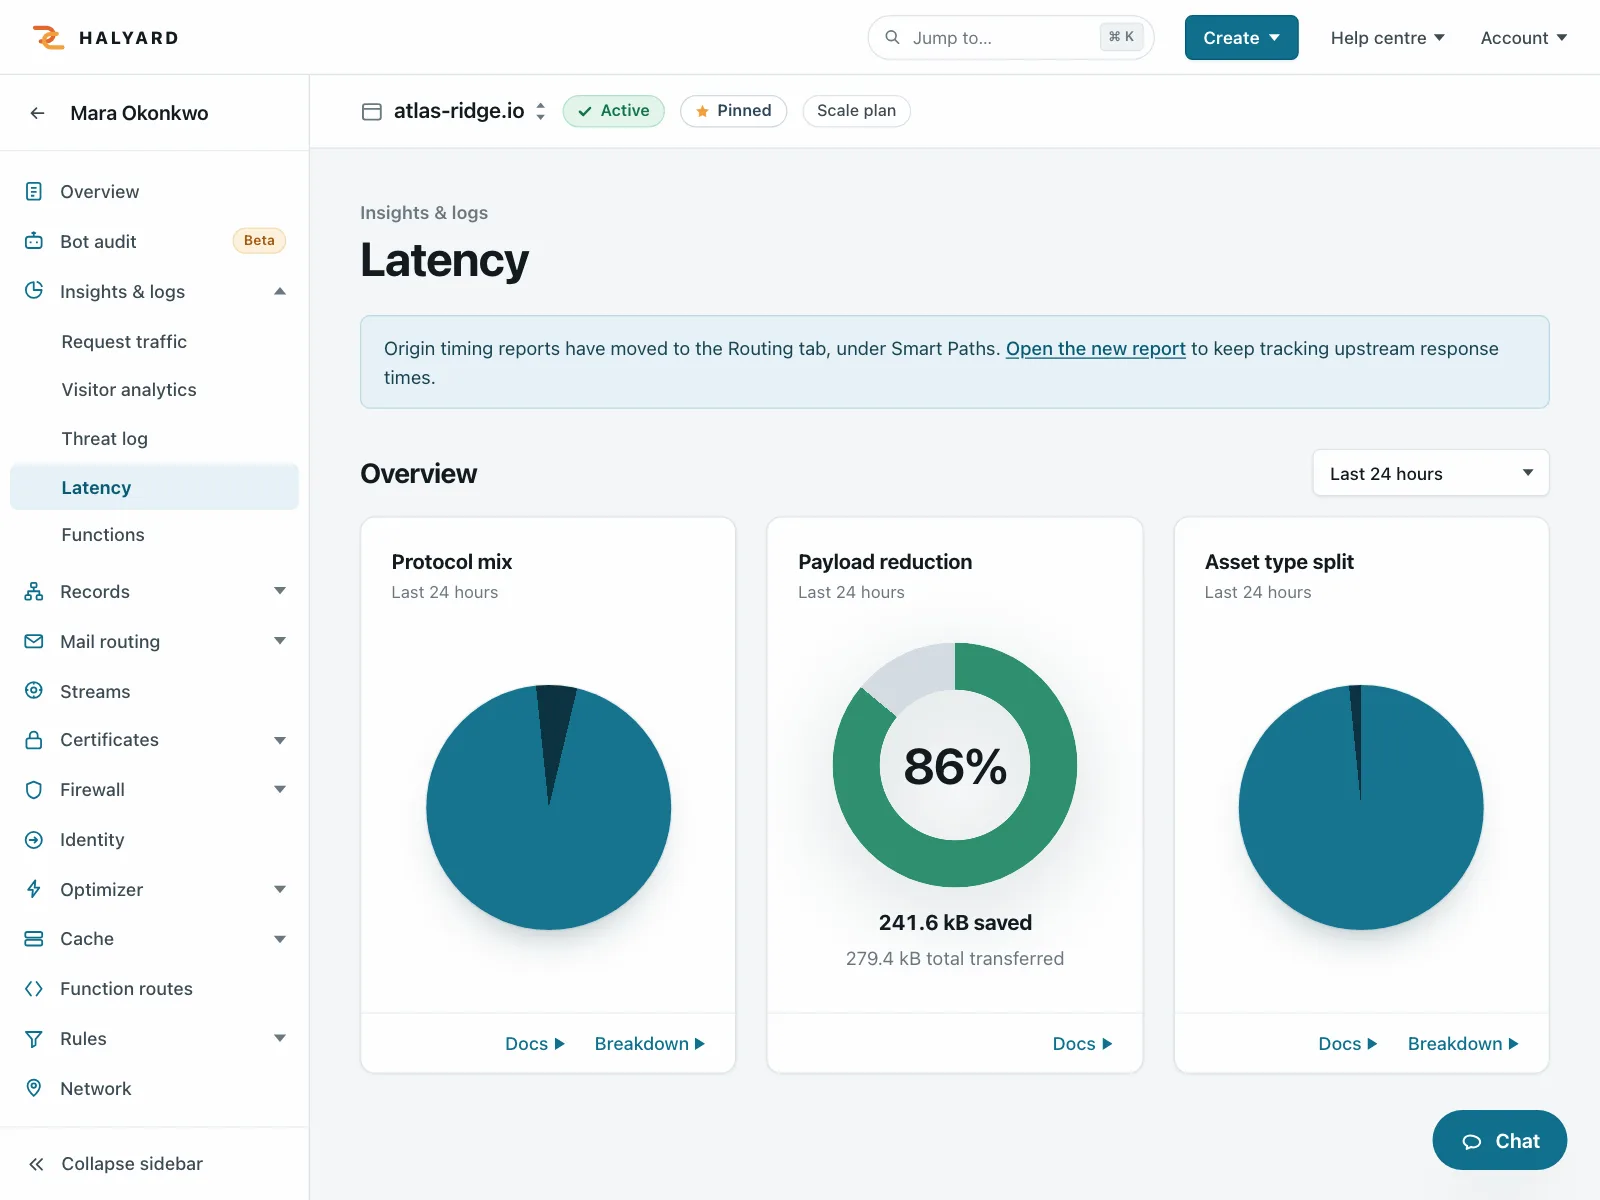
Charts view inside Fieldnote, a user research repository plotting highlight counts by tag. Style: light mode, white canvas, cool slate neutrals, steel blue accent, five-colour categorical set. Layout: project sidebar with section list, chart toolbar strip, grouped treemap blocks filling the board. Components: breadcrumb project switcher, dropdown configuration chips, colour legend, nested treemap tiles with counts. Vibe: analytical, tidy, research-led — UX research.
agent.kombai.com/kombai-inspiration-library/sections/charts/web/242/index.html
Fieldnote — Charts Section Example | Kombai