About this design
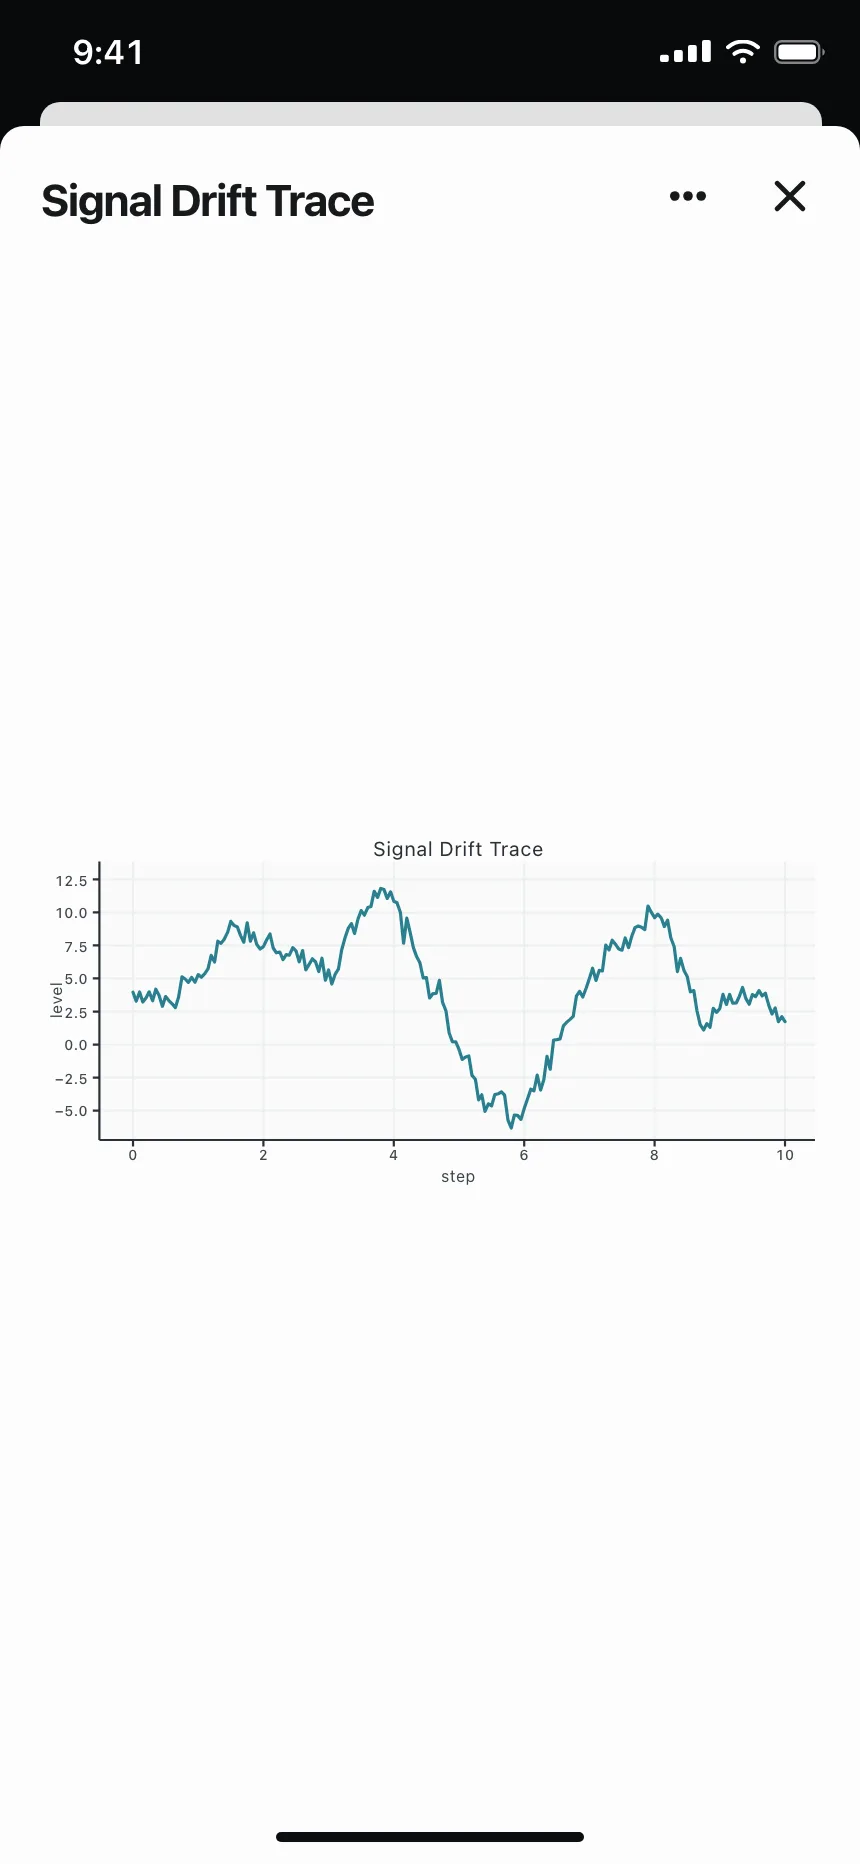
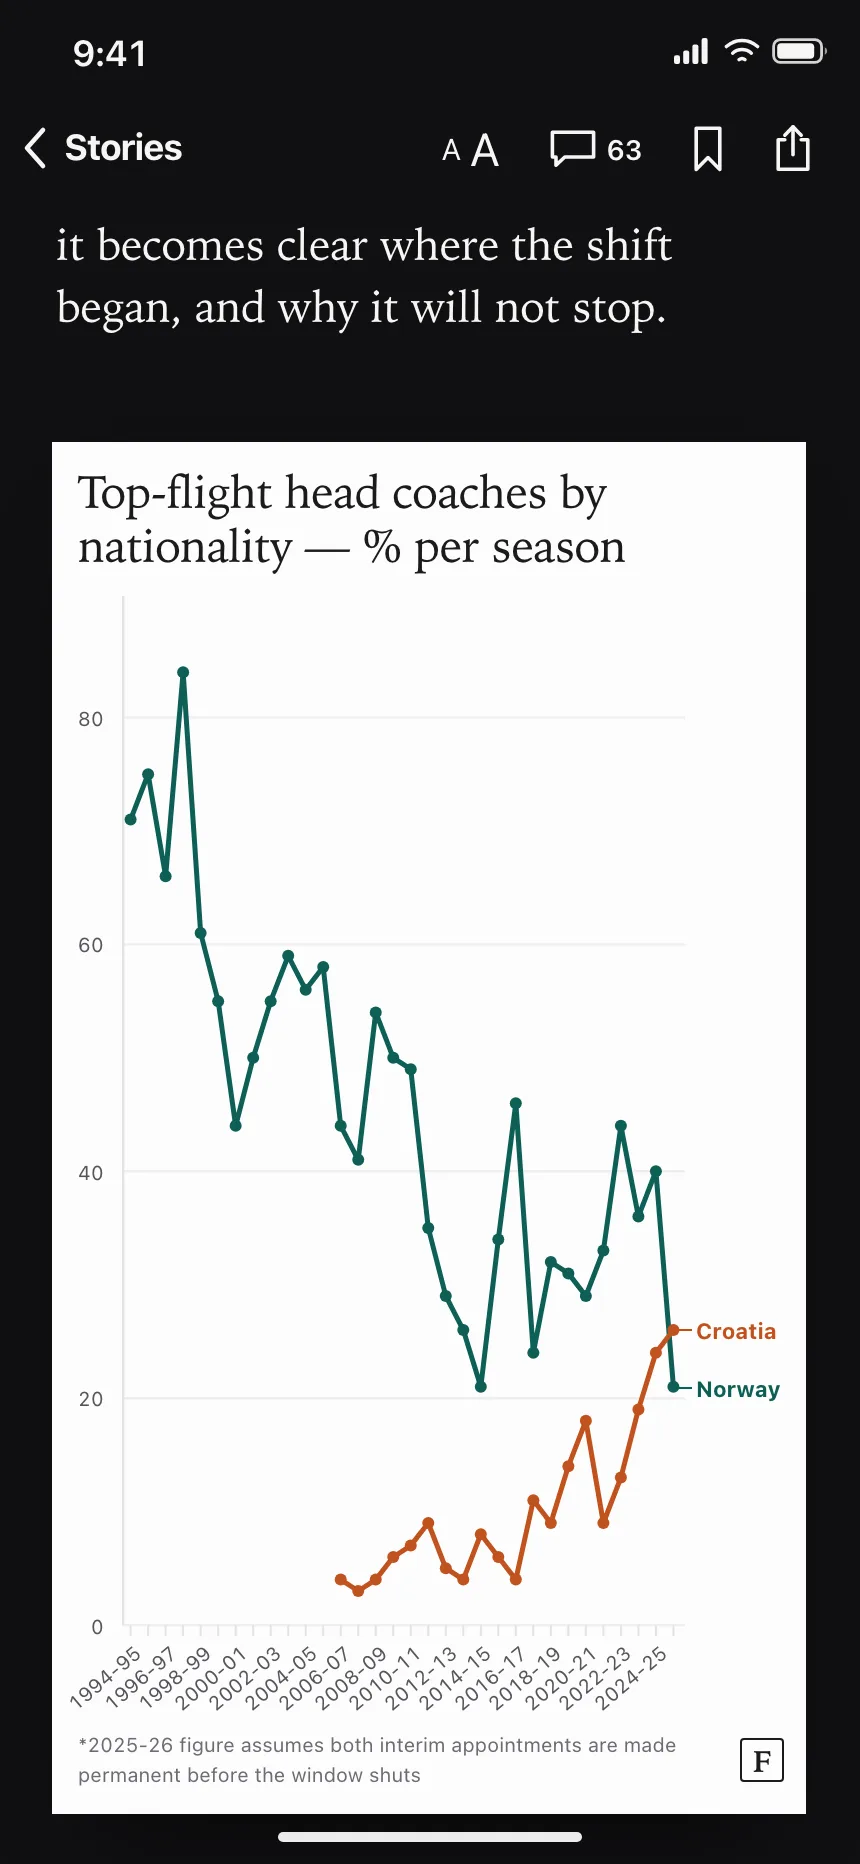
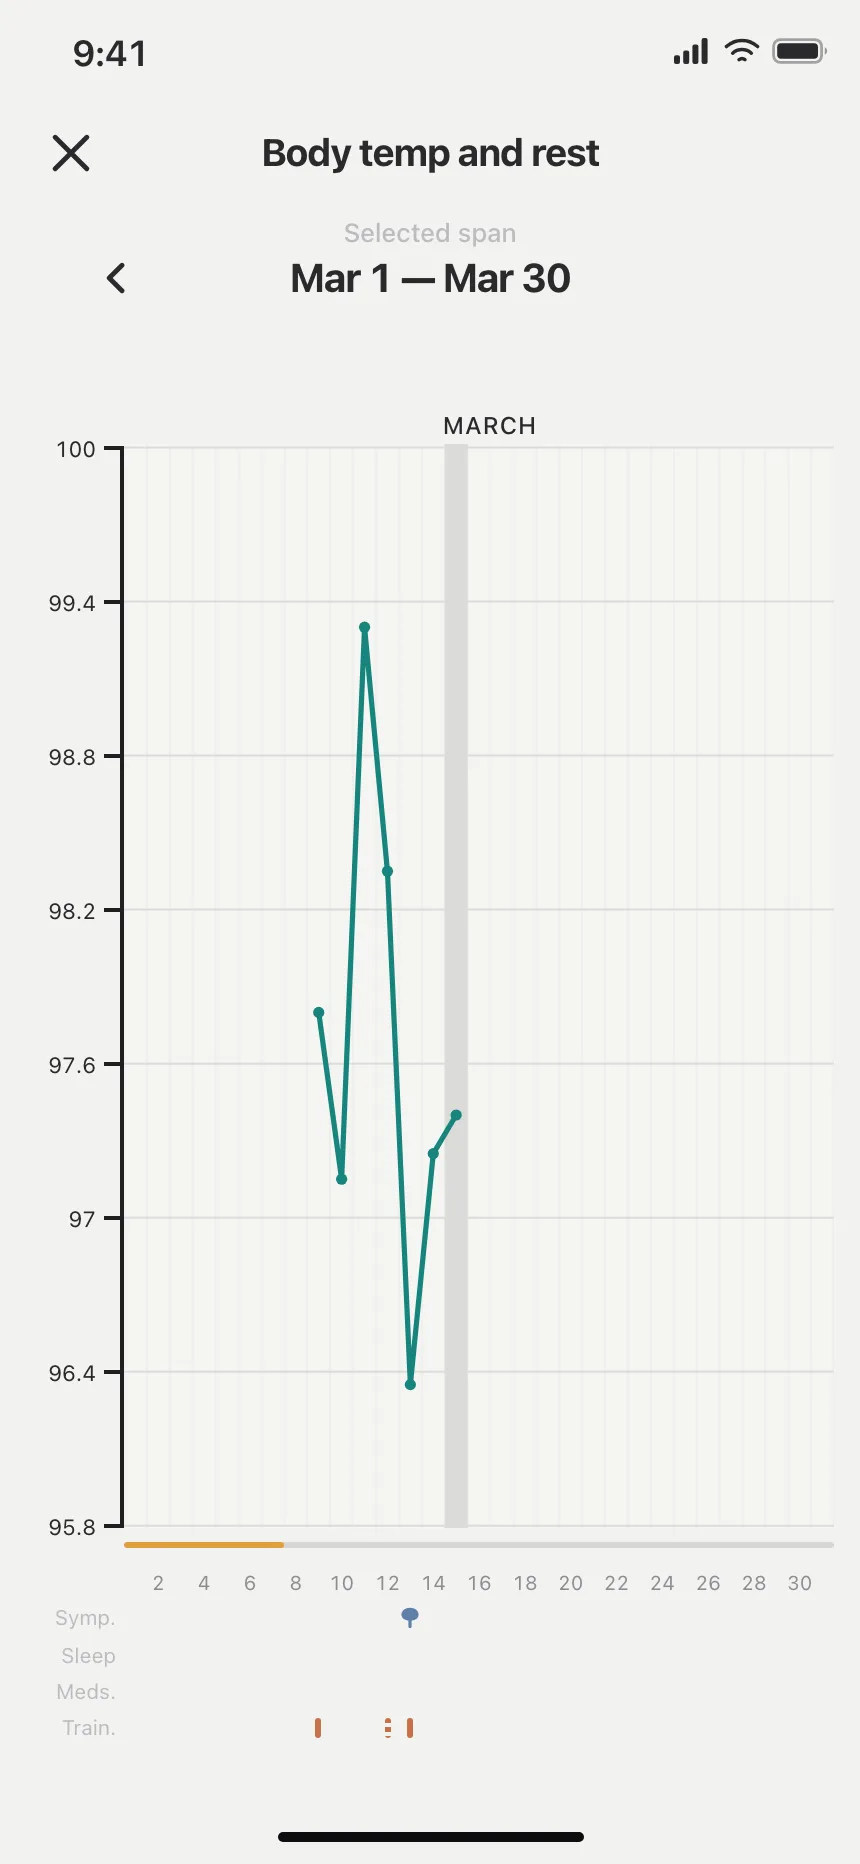
Tutorial step in Quorvane teaching how filtering narrows a data distribution.
- Style
- light, warm grey canvas, white plot card, teal accent, amber marker, old-style serif.
- Layout
- explanatory text above a gridded chart, a slider beneath it, then a full-width Continue button.