About this design
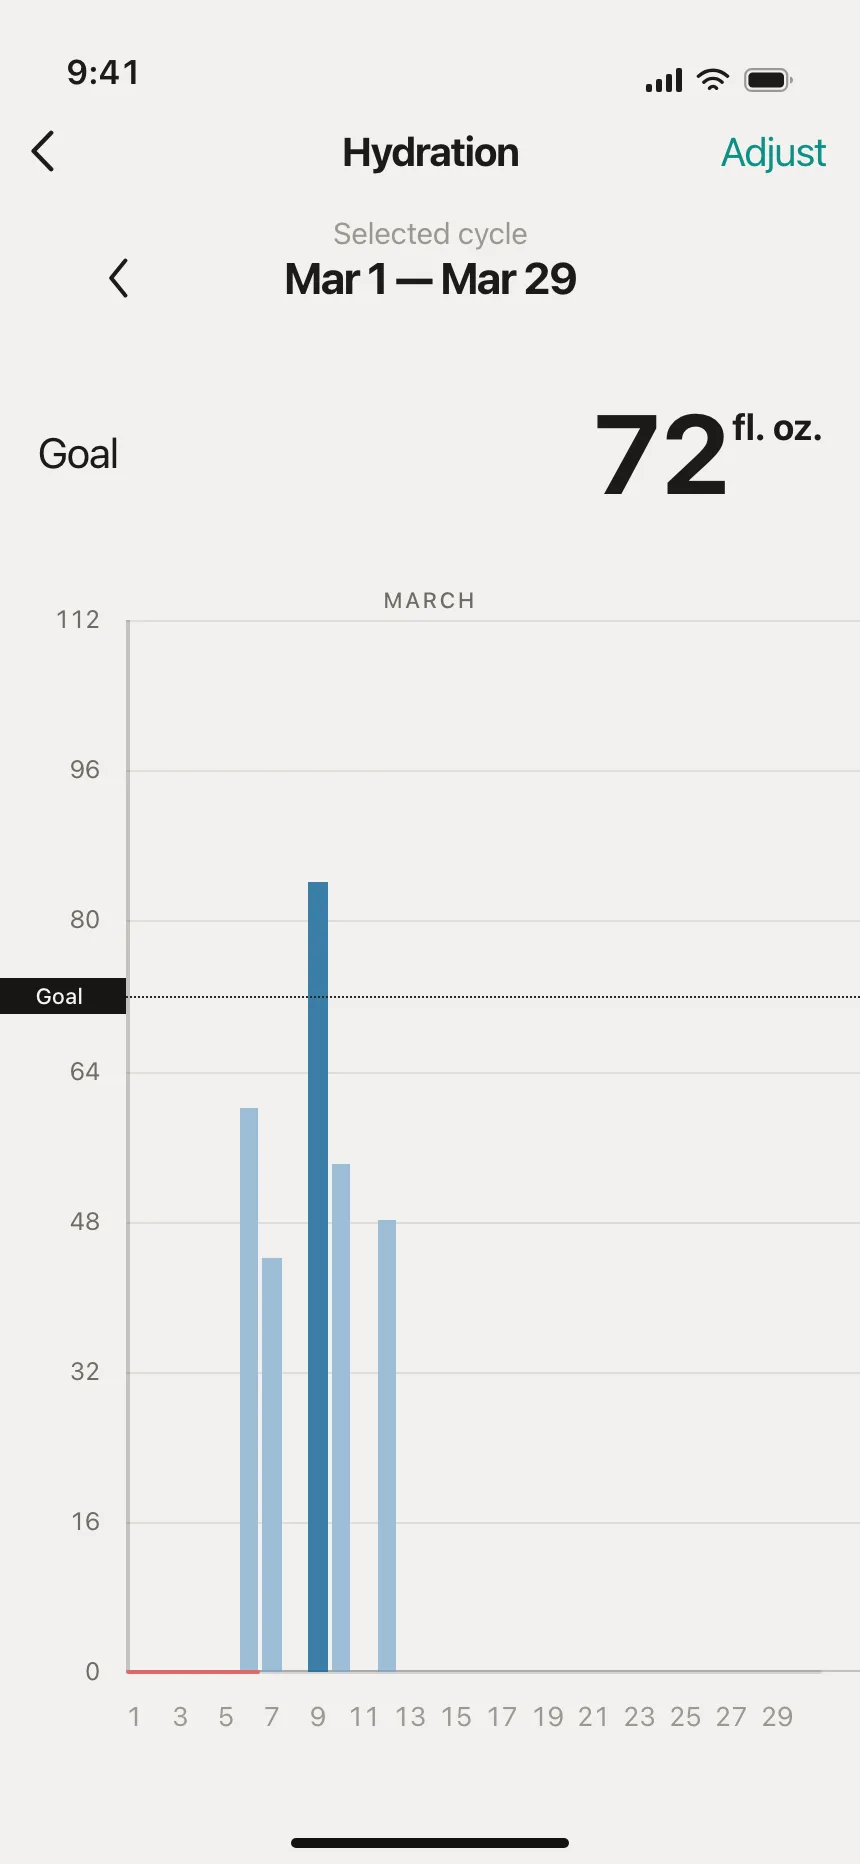
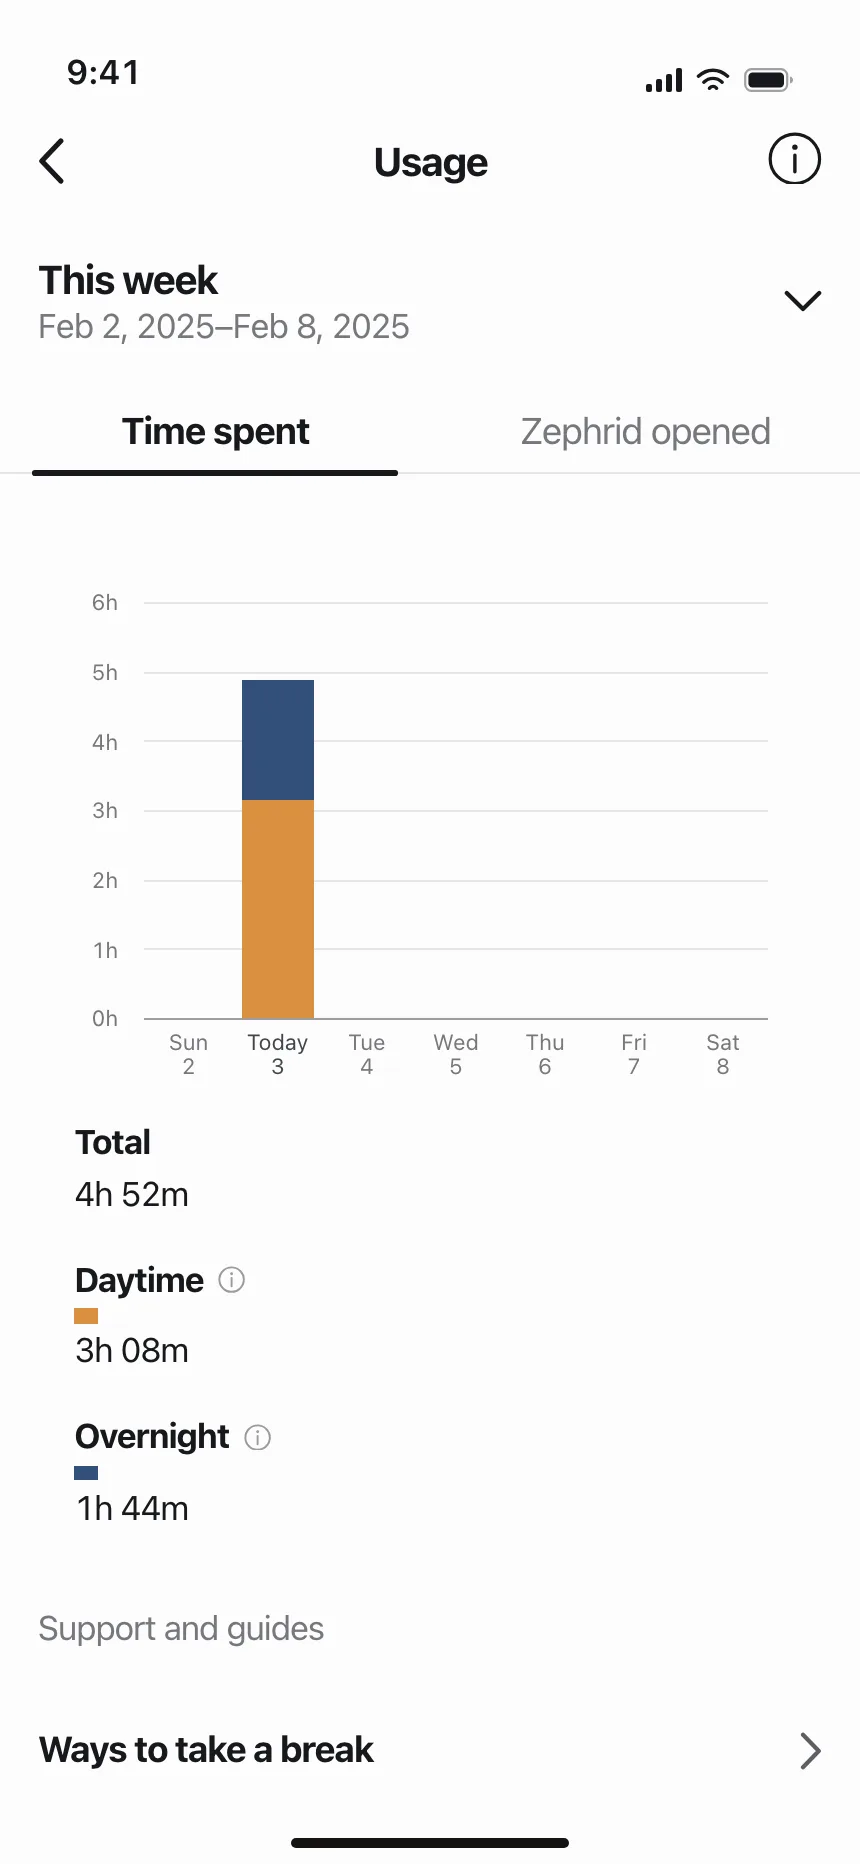
Store analytics sheet for Ostwell, breaking revenue down by sales channel.
- Style
- flat light, grey-blue canvas, white cards, brick-red accent.
- Layout
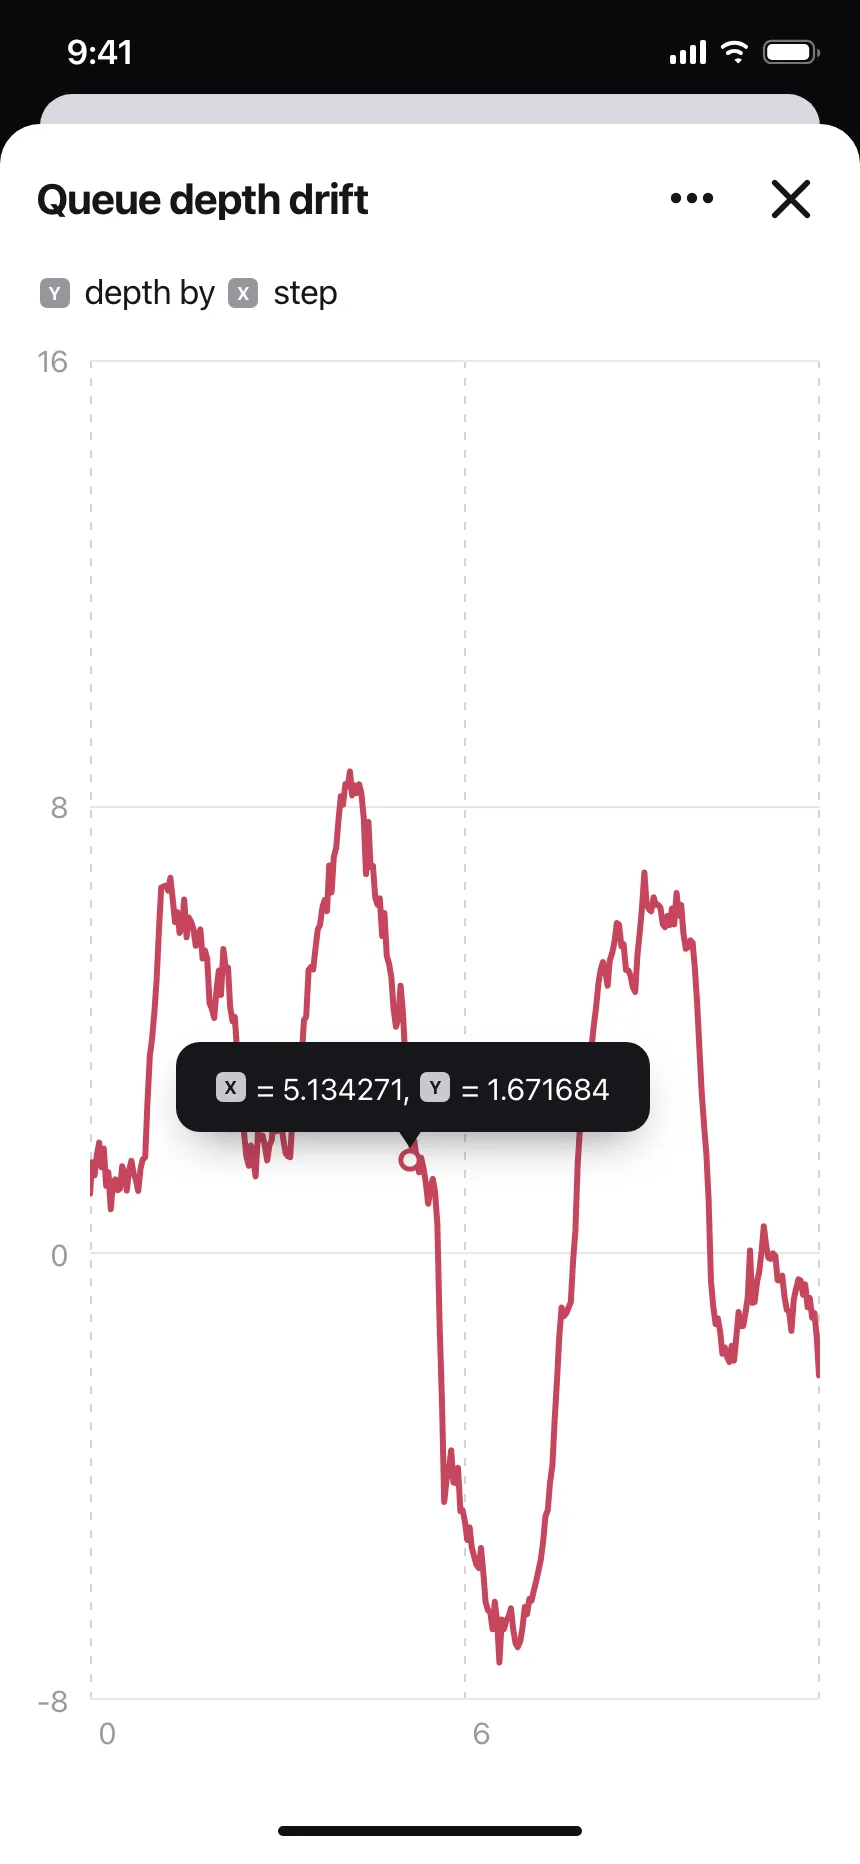
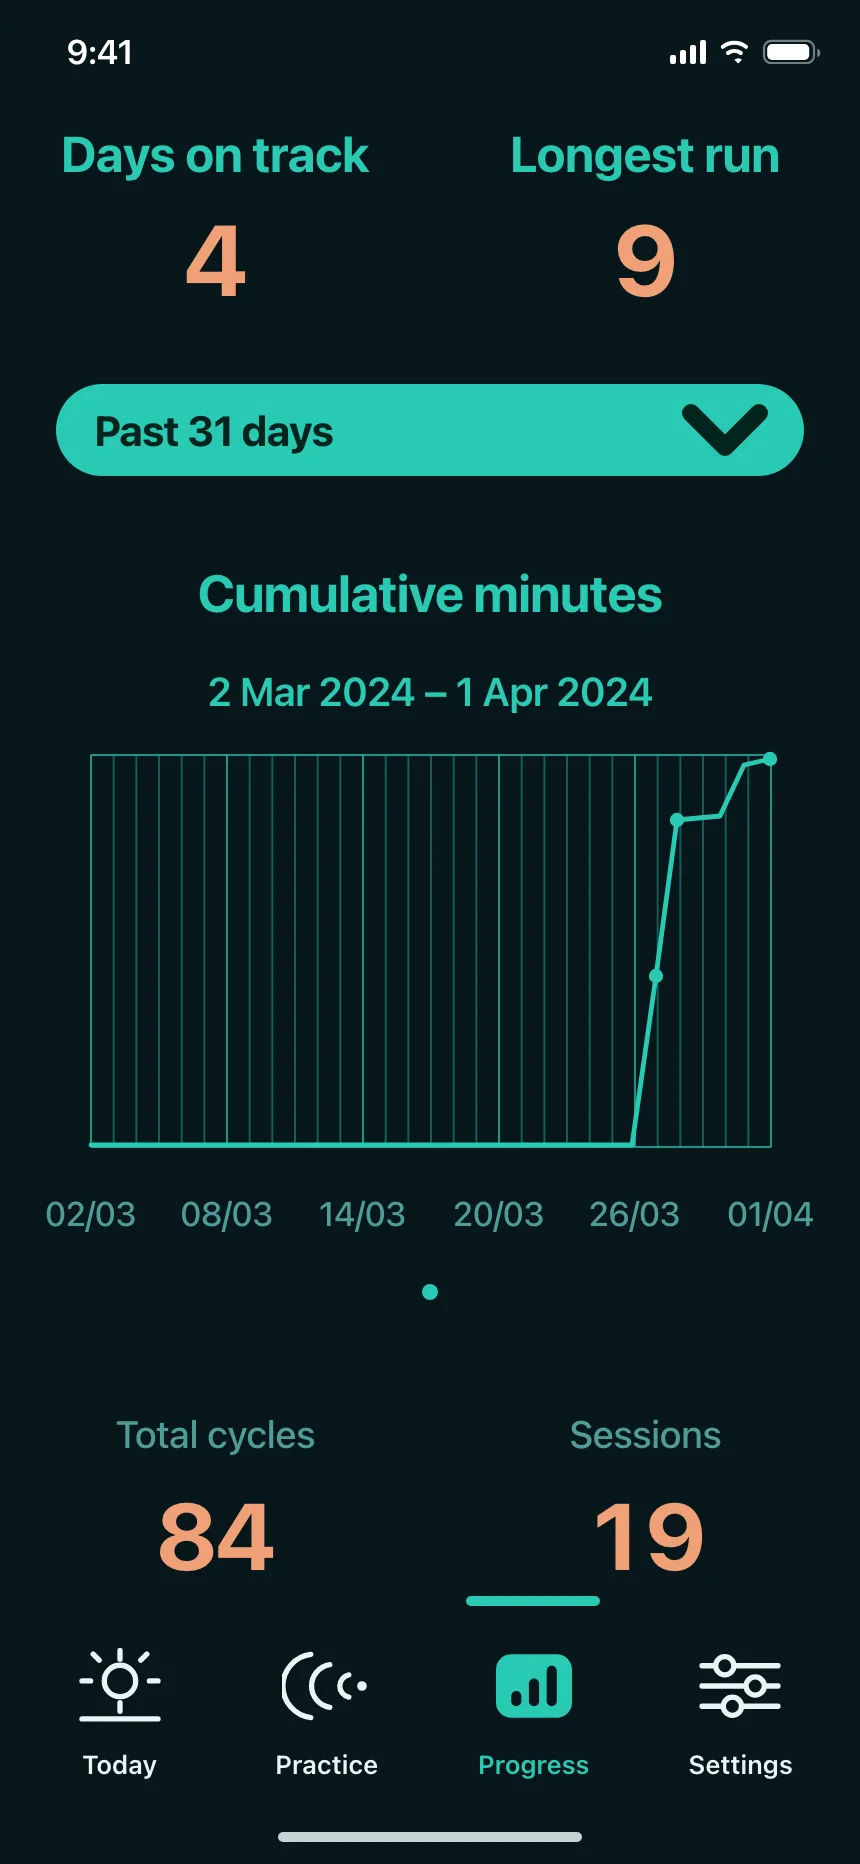
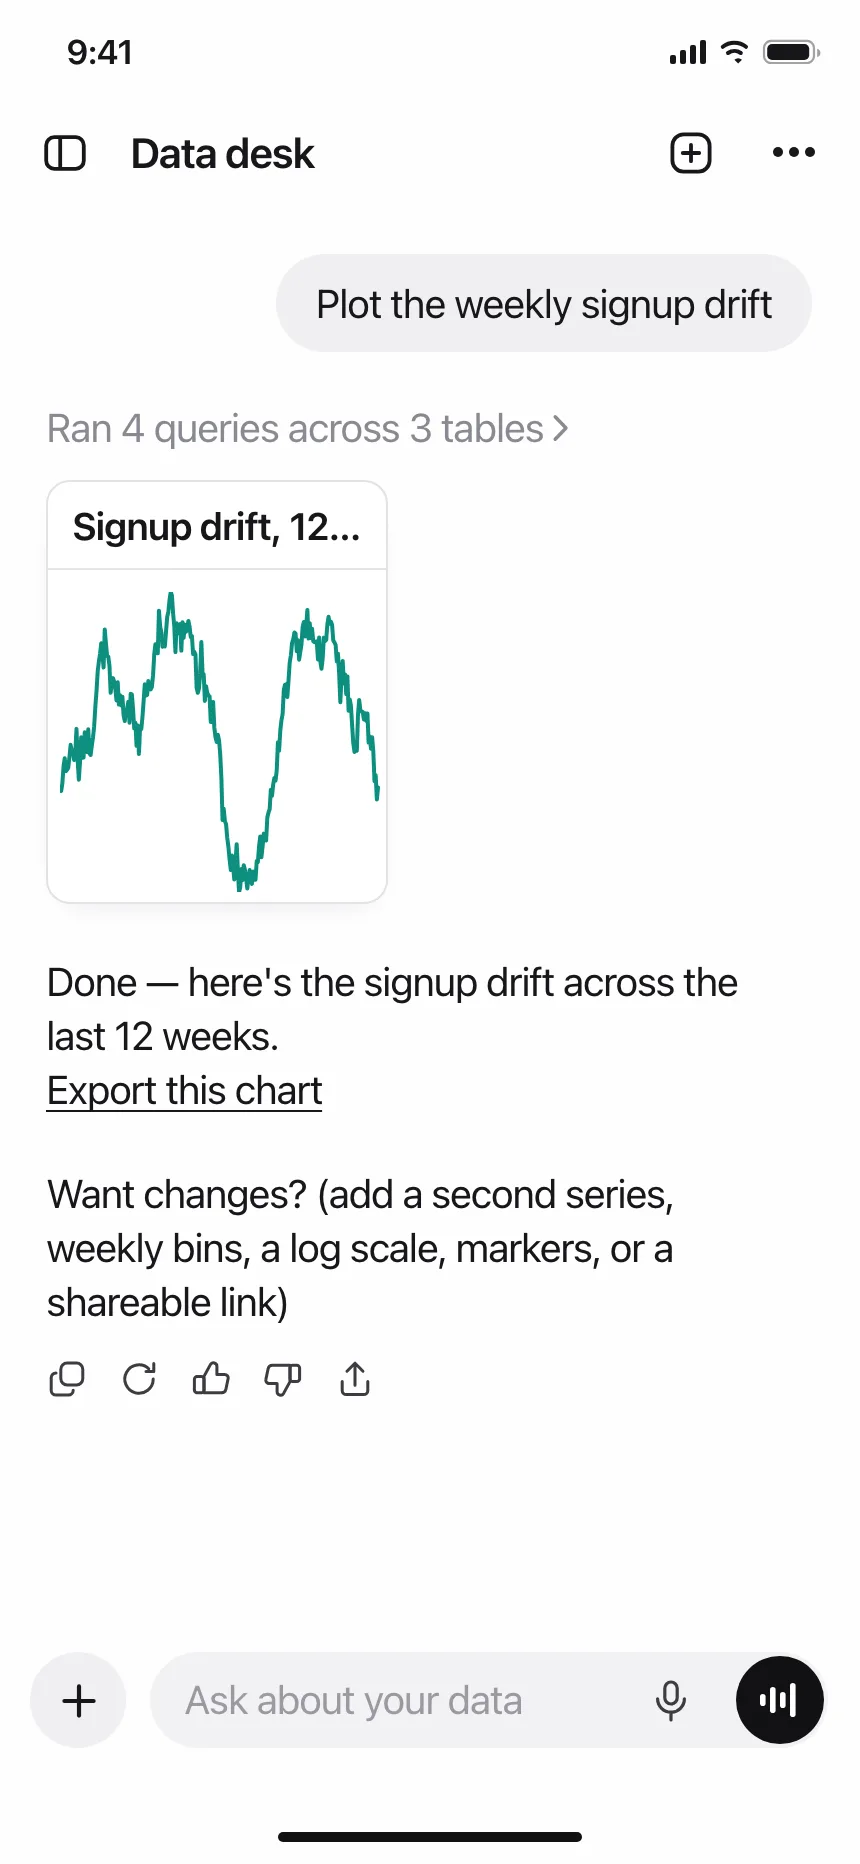
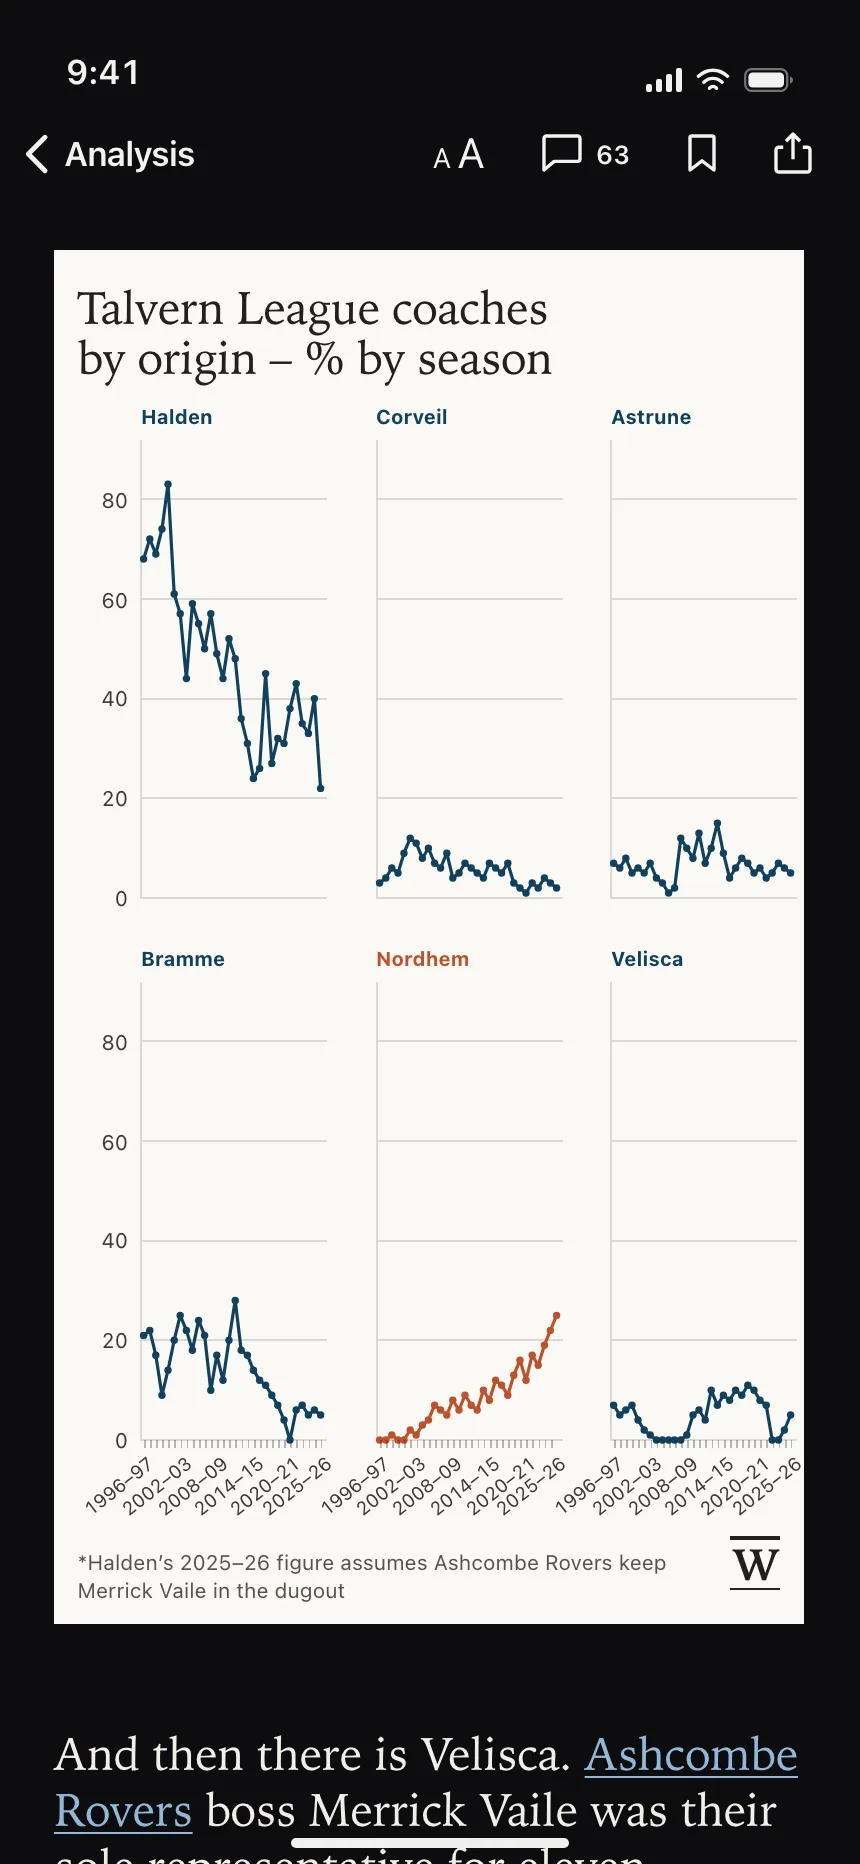
- Done nav row over two full-width cards, bar rows in the first, a time-series plot in the second.